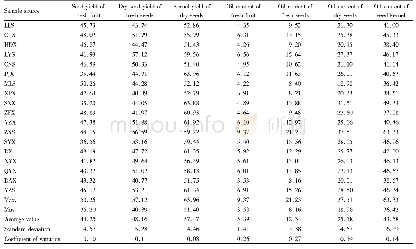
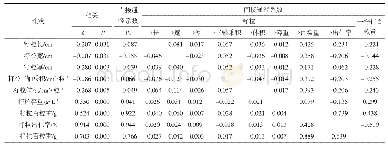
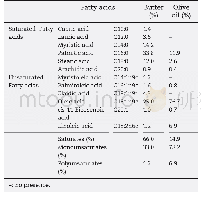
《Table 2–Analysis of oil content path coefficient of six fatty acid components.》
 提示:宽带有限、当前游客访问压缩模式
本系列图表出处文件名:随高清版一同展现
《"Mapping loci controlling fatty acid profiles, oil and protein content by genome-wide association study in Brassica napus"》
The results of GWAS showed that oil and protein contents were both associated with seven SNPs,with P value<4.58×10⁻⁷(Fig.1 and Table S5).Eleven SNPs significantly associated with oil content were identified on five different chromosomes,while 10 SNPs located on the same five chromosomes were significantly associated with protein content.Seven of the ten SNPs were detected for both two traits and were distributed on chromosomes A04,A07,C01,C02,and C03.Five of them were most significant SNPs in their chromosome,revealing that there were not only significant(r=-0.58,P<0.01)phenotypic associations but also genetic correlations between oil and protein contents.
| 图表编号 | XD0029305200 严禁用于非法目的 |
|---|---|
| 绘制时间 | 2019.04.01 |
| 作者 | Minqiang Tang、Yuanyuan Zhang、Yueying Liu、Chaobo Tong、Xiaohui Cheng、Wei Zhu、Zaiyun Li、Junyan Huang、Shengyi Liu |
| 绘制单位 | The Key Laboratory of Biology and Genetic Improvement of Oil Crops, The Ministry of Agriculture, Oil Crops Research Institute of Chinese Academy of Agricultural Sciences、National Key Laboratory of Crop Genetic Improvement, National Center of Crop Molecula |
| 更多格式 | 高清、无水印(增值服务) |


