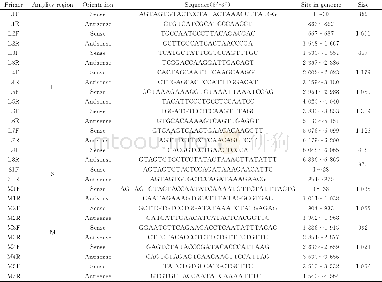
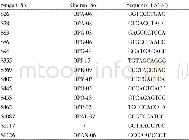
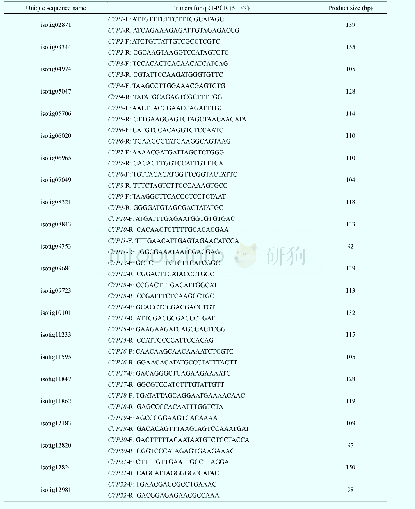
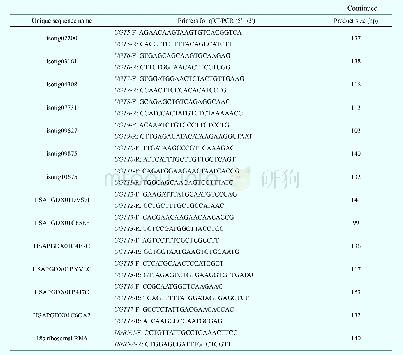
《Table 2 Primers for qRT-PCR analysis of CYPs and UGTs》
 提示:宽带有限、当前游客访问压缩模式
本系列图表出处文件名:随高清版一同展现
《Transcriptomic analysis in Anemone flaccida rhizomes reveals ancillary pathway for triterpene saponins biosynthesis and differential responsiveness to phytohormones》
To evaluate our transcriptomic analysis and screen for CYPs and UGTs that may be involved in biosynthesis of triterpene saponins,the qRT-PCR was performed to analyze all isotigs annotated as CYPs and UGTs in A.flaccida roots treated with one of three concentrations of three plant hormones(methyl jasmonate,Me JA;salicylic acid,SA;indole-3-acetic acid,IAA):0.05 mmol·L-1(MeJA1,SA1,and IAA1),0.5 mmol·L-1(Me JA2,SA2,and IAA2)and 5 mmol·L-1(MeJA3,SA3,and IAA3).The primers were designed using Roche LCPDS2 software(http://lightcycler-probe-designsoftware.software.informer.com/2.0/)according to the transcriptome sequences in this study and synthesized at Shanghai Generay Biotech(Shanghai,China).The primers for qRT-PCR were listed in Table 2.Quantitative PCR was performed using LightCycler 480 SYBR Green I Master kit and a LightCycler 480 System(Roche,Germany).The reaction mixture was as follows:5μL of 2X LightCycler 480 SYBR Green I Master,0.2μL of 10μmol·L-1 forward/reverse primers each,1μL of c DNA and 3.6μL of nuclease-free water.Reactions were incubated in a 384-well optical plate at 95°C for 10 min,followed by 40 cycles of 95°C for 10 s and 60°C for 30 s.Each sample was assayed in triplicate for analyses.At the end of the PCR cycles,melting curve analyses were performed to evaluate the specific PCR products.The melting curve was obtained by increasing the temperature slowly from 60°C to97°C and continuously performing five acquisitions per degree Celsius.The expression levels of the mRNAs were normalized to the 18S r RNA reference gene and were calculated using the2–ΔΔCT method[24-26].
| 图表编号 | XD0062383100 严禁用于非法目的 |
|---|---|
| 绘制时间 | 2019.02.20 |
| 作者 | MO Guo-Yan、HUANG Fang、FANG Yin、HAN Lin-Tao、Kayla K.Pennerman、BU Li-Jing、DU Xiao-Wei、Joan W.Bennett、YIN Guo-Hua |
| 绘制单位 | China Key Laboratory of TCM Resource and Prescription, Ministry of Education, Hubei University of Chinese Medicine、China Key Laboratory of TCM Resource and Prescription, Ministry of Education, Hubei University of Chinese Medicine、China Key Laboratory of T |
| 更多格式 | 高清、无水印(增值服务) |


