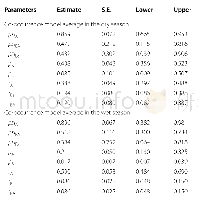
《Table 1 Variables used to estimate the site occupancy rate and detection probability of Tibetan Sno
 提示:宽带有限、当前游客访问压缩模式
本系列图表出处文件名:随高清版一同展现
《Habitat use and diel activity pattern of the Tibetan Snowcock(Tetraogallus tibetanus):a case study using camera traps for surveying high-elevation bird species》
To examine the habitat use of the Tibetan Snowcock,we divided the entire monitoring period into consecutive 5-day segments.Then,as described by Mackenzie et al.(2002),we set up a Tibetan Snowcock detection matrix,which would meet the two assumptions of this model as outlined in the introduction.Each element in the matrix represented one segment at one camera trap sampling site.We used 1 to represent that the Tibetan Snowcock was detected in this segment,used 0 to represent no detection,and used NA to represent data missing.Detection probability of the Tibetan Snowcock was assessed in relation to two detection covariates,and ten site covariates were considered to be potentially influential for its habitat use(Table 1).The elevation,slope,and aspect data were recorded by the field staff.The EVI(enhanced vegetation index)data were acquired from the Geospatial Data Cloud of the Chinese Academy of Sciences(http://www.gsclo ud.cn).The administration of the Gongga Mountain National Nature Reserve provided the raw data on rivers,settlements,and roads.Therefore,the other six site variables(distance to the nearest river,distance to the nearest settlement,distance to the nearest road,river density,settlement density,road density)were extracted using geographic information systems(GIS)and the raw data.
| 图表编号 | XD0047412500 严禁用于非法目的 |
|---|---|
| 绘制时间 | 2019.03.01 |
| 作者 | Gai Luo、Chuangming Yang、Huaming Zhou、Michael Seitz、Yongjie Wu、Jianghong Ran |
| 绘制单位 | Key Laboratory of Bio-Resources and Eco-Environment of Ministry of Education,College of Life Science,Sichuan University、Key Laboratory of Bio-Resources and Eco-Environment of Ministry of Education,College of Life Science,Sichuan University、The Administrat |
| 更多格式 | 高清、无水印(增值服务) |
查看“Table 1 Variables used to estimate the site occupancy rate and detection probability of Tibetan Snowcock in the occupanc”的人还看了
-

- Table 1.details of the cmip5 models.All the models are used to derive the 1.5 and 2°c threshold-crossing time in Figure
-

- Table 6 Use efficiency of fertilizers to the actual yield of rice in the early and late rice cropping fields and LAD


