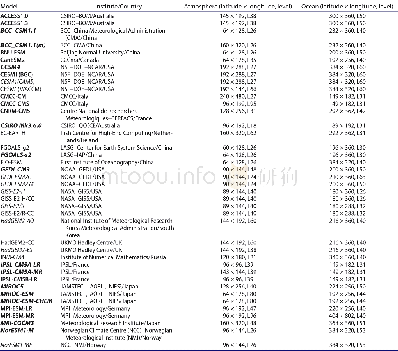
《Table 1.details of the cmip5 models.All the models are used to derive the 1.5 and 2°c threshold-cro
 提示:宽带有限、当前游客访问压缩模式
本系列图表出处文件名:随高清版一同展现
《丝绸之路核心区达到1.5度和2度温升的时间和相应的气候变化(英文)》
note:aindicates that the full name of JAmstec,Aori,nies is“Atmosphere and ocean research institute(the University of tokyo),national institute for environ-mental studies,and Japan Agency for marine-earth science and technology”.
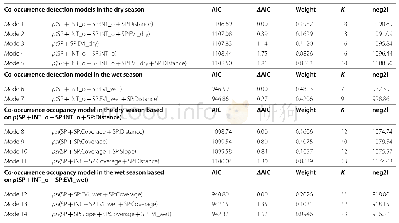
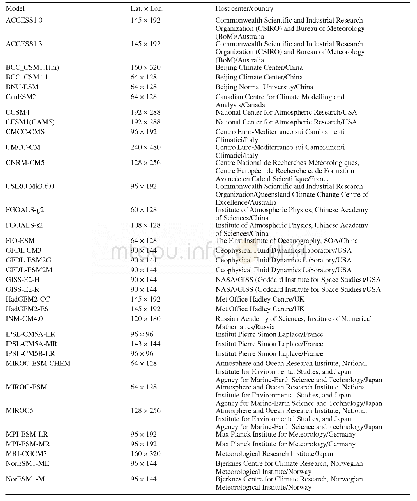
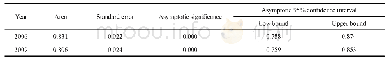
The historical simulations and projections under different Representative Concentration Pathways(RCPs)from coupled climate models in CMIP5(Taylor,Stouffer,and Meehl2012)are analyzed.The models used in the construction of the analysis fields given in this study vary with the research focus,since we hope to use as many model results as possible to reduce the uncertainties.As summarized in Table1,data from 24 models are used to calculate the regional average annual mean surface air temperature(SAT)and precipitation under all four RCP scenarios(RCP2.6,RCP4.5,RCP6.0,and RCP8.5),shown in Figure 2.The projected SAT under two RCPs(RCP4.5 and RCP8.5)is derived from 40CMIP5 climate/earth system models(Table 1)and used to calculate the 1.5 and 2°C threshold-crossing times shown in Figure 3.Taking 2°C warming for example,this is defined as the SAT anomalies larger than 2°C relative to the mean state during 1861–1890 in the historical simulation.To reduce the uncertainty in calculating the threshold-crossing time due to interannual variability,a nine-year running average is used to smooth the time series of SAT anomalies.Then,the 2°C threshold-crossing time is defined as thefirst year when the SAT anomalies reach 2°C.The model outputs are remapped onto a 5°×5°grid by bilinear interpolation for reliable large-scale information.
| 图表编号 | XD00187336100 严禁用于非法目的 |
|---|---|
| 绘制时间 | 2018.03.16 |
| 作者 | ZHOU Tian-Jun、SUN Ning、ZHANG Wen-Xia、CHEN Xiao-Long、PENG Dong-Dong、LI Dong-Huan、REN Li-Wen、ZUO Meng |
| 绘制单位 | LASG, Institute of Atmospheric Physics, Chinese Academy of Sciences、University of Chinese Academy of Sciences、Climate Change Research Center, Chinese Academy of Sciences、LASG, Institute of Atmospheric Physics, Chinese Academy of Sciences、University of Chi |
| 更多格式 | 高清、无水印(增值服务) |