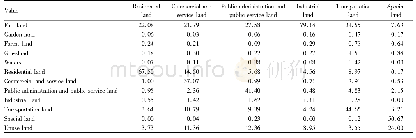
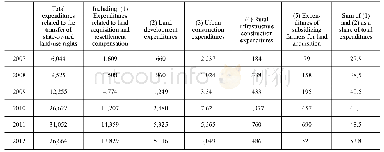
《Table 1 The transfer matrix of urban land use from 2001 to 2016》
 提示:宽带有限、当前游客访问压缩模式
本系列图表出处文件名:随高清版一同展现
《Optimization of Urban Land Use Structure Based on the Perspective of GMOP-GA——A Case Study of the Urban Districts of Hohhot》
%
In the land use top-level structure,there are two land use categories:non-construction land which includes agricultural land use and unused land,and construction land.The two land use categories can takes as the basic perspective of qualitative classification and quantitative evaluation,combined with the spatial statistical data of relevant land categories of area under the districts of Hohhot in 2001,2010 and 2016,then respectively analyzed and evaluated the change characteristics and trend of overall structure of three land use categories and each category of subdivided land use,especially pay attention to research the spatial pattern change of each type of subdivided construction land.From the perspective of the transfer of urban construction land area and its relationship with the change of non-construction land area,there is a clear corresponding relationship between the changes in urban land use layout and the urban economic construction activities of the departments.The adjustment of the requirements of urban economic construction and development will inevitably lead to changes in the proportion of urban construction land use types[9].Hence,under the premise of fixed total land area,the sector division and scale expansion of the urban economic departments will inevitably deteriorate the development trend of continuously declining proportion of non-construction land and increasing constantly proportion of construction land since 2001.As shown in Table 1,in the aspect of the land source composition of increase area for all kinds of urban construction land from 2001 to 2016,farmland became an important source for urban construction land area constantly increased,especially it had accounted for the largest proportion in the land source of most of increased construction land types,and occupied a larger proportion in the increased area composition of industrial land,transportation land and public administration and public service land in turn.Accordingly,the number of construction land structure change reflected in the spatial layout,which can be characterized by the distribution of industrial land and public administration and public service land were concentrated with the edge of urban build-up area.
| 图表编号 | XD00182640700 严禁用于非法目的 |
|---|---|
| 绘制时间 | 2018.11.01 |
| 作者 | Tongyu TIAN、Mei YU、Hong SU |
| 绘制单位 | College of Geographical Science,Inner Mongolia Normal University、College of Geographical Science,Inner Mongolia Normal University、College of Geographical Science,Inner Mongolia Normal University |
| 更多格式 | 高清、无水印(增值服务) |
