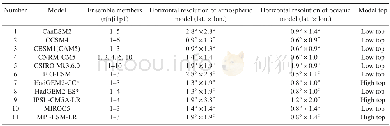
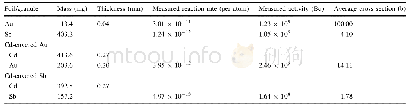
《Table 1.List of the CMIP5 models and their ensemble members used in this study, where“high top”indi
 提示:宽带有限、当前游客访问压缩模式
本系列图表出处文件名:随高清版一同展现
《Remarkable Link between Projected Uncertainties of Arctic Sea-Ice Decline and Winter Eurasian Climate》
To answer these questions,we focus on the intermodel spread of the forced response to the Arctic sea-ice decline.To minimize the internal atmospheric variability,we only analyze the 11 CMIP5 models(https://esgf-node.llnl.gov/projects/esgf-llnl/)that include at least three ensemble members for both the historical and RCP8.5 simulations(Table1).The forced response is regarded as the climatological difference between the period 2069–98 in the RCP8.5 run and1971–2000 in the historical run;below,we refer to this difference simply as“the response”.In each model,the climatology is the unweighted average of all ensemble members listed in Table 1.The multimodel ensemble mean(MME)response is defined by averaging the individual model means.The reason for choosing 2069–98 instead of 2071–2100 is due to some missing outputs in 2099 and 2100.All atmospheric and oceanic variables are interpolated to a horizontal resolution of 2.5?×2.5?and 1.0?×1.0?,respectively.
| 图表编号 | XD0015816600 严禁用于非法目的 |
|---|---|
| 绘制时间 | 2018.01.10 |
| 作者 | Hoffman H.N.CHEUNG、Noel KEENLYSIDE、Nour-Eddine OMRANI、Wen ZHOU |
| 绘制单位 | Geophysical Institute,University of Bergen、Bjerknes Centre for Climate Research,University of Bergen、Geophysical Institute,University of Bergen、Bjerknes Centre for Climate Research,University of Bergen、Nansen Environmental and Remote Sensing Center、Geophy |
| 更多格式 | 高清、无水印(增值服务) |