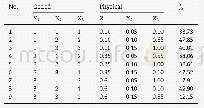
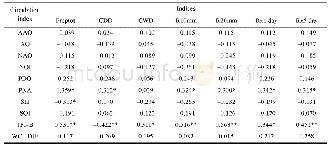
《Table 4 The RMSE and SAE values between the verified FVC and FVC estimated using the pixel dichotom
 提示:宽带有限、当前游客访问压缩模式
本系列图表出处文件名:随高清版一同展现
《Comparative Analysis of Fractional Vegetation Cover Estimation Based on Multi-sensor Data in a Semi-arid Sandy Area》
In this paper,we compared the FVC inversion abilities of S2 and L8 sensor data in arid land.The results showed that the S2 MSI data performed better than did the L8 OLI data with respect to FVC inversion.The arguments below may explain these results.First,the spatial resolution of the vegetation monitoring bands of S2 is higher than that of the L8 OLI sensor.The red(band 3)and NIR(band 8)bands of the S2 MIS sensor are 10 m,and the analogous bands of L8 are 30 m(Table 1).The higher the resolution is,the more detail that can be captured.Second,the spectral configuration of the red and NIR bands of the S2 MSI sensor may be more suitable for capturing vegetation information than that of the Landsat OLI sensor.On the one hand,as shown in Table 1 and Fig.9,the narrower wavelength range of the S2 red band(650–680 nm)was more likely to capture the reflectance valley of vegetation than is the L8 red band(630–680 nm).On the other hand,in terms of the spectral response of the red band,the L8 red band responded weakly in the wavelength range that is characteristic of vegetation(675–685 nm)(Fig.9 and Fig.10) .By contrast,in this characteristic wavelength range,the S2 red band responded strongly(Fig.9 and Fig.10).The wavelength range of the NIR band(8 band)(785–900 nm) of S2 was much wider than that of the NIR band(845–885 nm)of L8.In addition,according to Fig.10,from approximately 775 nm to 910 nm,the S2NIR band(band 8)had a strong spectral response;by contrast,a strong spectral response for the L8 NIR band occurred only in the wavelength range of 840 nm to 890nm.In addition,the vegetation reflectance tended to steadily increase from 680 nm to approximately 900 nm(Fig.9).In this case,the S2 NIR band(8 band),which had a longer wavelength and wider spectral response range than did the NIR band of L8,had stronger abilities to capture vegetation information than did L8.
| 图表编号 | XD0046959500 严禁用于非法目的 |
|---|---|
| 绘制时间 | 2019.02.01 |
| 作者 | LIU Qiuyu、ZHANG Tinglong、LI Yizhe、LI Ying、BU Chongfeng、ZHANG Qingfeng |
| 绘制单位 | College of Natural Resources and Environment, Northwest A&F University、College of Natural Resources and Environment, Northwest A&F University、College of Natural Resources and Environment, Northwest A&F University、College of Natural Resources and Environme |
| 更多格式 | 高清、无水印(增值服务) |
查看“Table 4 The RMSE and SAE values between the verified FVC and FVC estimated using the pixel dichotomy model”的人还看了
-
- 表5 极限承载力试验值与规范值比较Table 5 Comparison between the test value of ultimate bearing capacity and the estimated value accordin
-

- 表6 试件受弯承载力计算值与试验值对比Table 6 Comparison on the calculated values and tested values of the specimens’fexure capacity
-
- 表4 偏心受压承载力试验值与规范计算值的对比Table 4 Comparison between test result and the same value in masonry structures code
