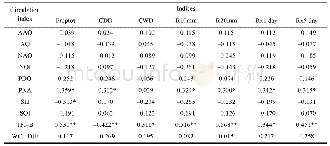
《Table 7 The correlation coefficient values between precipitation extremes in CA and atmospheric cir
 提示:宽带有限、当前游客访问压缩模式
本系列图表出处文件名:随高清版一同展现
《通过气温和降水极值追踪中亚地区的气候变化(英文)》
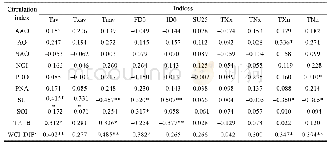
**Significant at p<0.01;*Significant at p<0.05.WCI_DJF denotes WCI in December,January and February.
Spearman’s correlation analysis was conducted to investigate the statistical relationships between the 17 climate extremes and 10 atmospheric circulations(AAO,AO,NAO,NOI,PDO,PNA,SH,SO,TPI_B and WCI)in CA.The results showed that,in 1957–2005,SH and WCI had significant correlations with temperature extremes(Table 6),while TPI_B and PNA showed good consistency with precipitation extremes(Table 7).SH showed significant correlation with Tav,Txav,Tnav,FD0,ID0,TXn,TNn and Prcptot(correlation coefficient R=–0.415,–0.331,–0.457,0.320,0.507,–0.350,–0.365 and–0.313,respectively),and WCI exhibited significant correlation with Tav,Tnav,FD0,TXn and TNn(R=0.402,0.485,–0.382,0.347,and 0.394,respectively).TPI_B had good consistency with Tav,Tnav,ID0,Prcptot,CDD,CWD,R10,R20,Rx1 and Rx5(R=0.312,0.326,–0.377,0.531,–0.422,0.311,0.516,0.568,0.344 and 0.451,respectively),whereas PNA had significant correlation with Prcptot,CDD,R10,R20mm,Rx1,Rx5(R=0.359,–0.312,0.324,0.300,0.342 and0.315,respectively).From the preceding,we can see that both SH and TPI_B had significant correlation(p<0.05)with Tav,Tnav and Prcptot.SH had significant correlation(p<0.05)with 7 temperature extremes and strong correlation(p<0.01)with 3 temperature extremes.TPI_B showed good consistency(p<0.05)with all 7 precipitation extremes in this study and significant correlation(p<0.01)with 5 of them.WCI was highly correlated with Tav(p<0.01),but not with Prcptot(p>0.05).PNA had significant correlation with Prcptot(p>0.05),but not with Tav(p>0.05).Based on these findings,we speculate that SH and TPI_B were the most important atmospheric circulation factors influencing the temperature and precipitation extremes of CA during 1957–2005.
| 图表编号 | XD0047165000 严禁用于非法目的 |
|---|---|
| 绘制时间 | 2019.01.01 |
| 作者 | 张曼、陈亚宁、沈彦俊、李宝富 |
| 绘制单位 | College of Resources and Environmental Science, Hebei Normal University、State Key Laboratory of Desert and Oasis Ecology, Xinjiang Institute of Ecology and Geography, CAS、State Key Laboratory of Desert and Oasis Ecology, Xinjiang Institute of Ecology and |
| 更多格式 | 高清、无水印(增值服务) |
查看“Table 7 The correlation coefficient values between precipitation extremes in CA and atmospheric circulations”的人还看了
-

- Table 5 Correlation coefficients between the cold injury index of bitter gourd and main agronomic traits of bitter gourd
-

- Table 6 The correlation coefficient values between temperature extremes in CA and atmospheric circulations


