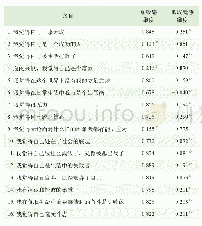
《Table 4 Pearson, s correlation coefficient and P value between Hg flux and impact factors in spring
 提示:宽带有限、当前游客访问压缩模式
本系列图表出处文件名:随高清版一同展现
《Measurement and Scaling of Mercury on Soil and Air in a Historical Artisanal Gold Mining Area in Northeastern China》
The summary of TGM measured seasonally from all sampling sites is shown in Table 1.The data indicate that the mean TGM was(55±21)ng/m3 in the research area during the sampling period,and those in Jiapigou Township,Wudaocha,Sandaocha,Erdaocha,Laojinchang and Erdaogou were(56±33)ng/m3,(33±13) ng/m3,(116±28) ng/m3,(94±33) ng/m3,(22±8) ng/m3 and(24±10)ng/m3,respectively.These values were obviously higher than those shown in the previous study(Wan et al.,2009),in which it was reported that the annual mean value of TGM was(3.22±1.78)ng/m3 on Changbai Mountain,the highest mountain in Northeast China.The monitoring values in this campaign were also much higher than the TGM background value(1.5–2.0 ng/m3)of the Northern Hemisphere(Ebinghaus et al.,2002;Lamborg et al.,2002;Steffen et al.,2002).
| 图表编号 | XD0046961300 严禁用于非法目的 |
|---|---|
| 绘制时间 | 2019.04.01 |
| 作者 | WANG Zhaojun、ZHANG Gang、CHEN Xiaobing、ZHAO Qiaojing、WANG Weiying、SHENG Lianxi、BIAN Hongfeng、LI Zhenxin、WANG Deli |
| 绘制单位 | State Key Lab for Environmental Protection, Wetland Ecology and Vegetation Restoration, Northeast Normal University、School of Environment, Northeast Normal University、School of Environment, Northeast Normal University、Institute of Grassland Science,Northe |
| 更多格式 | 高清、无水印(增值服务) |
查看“Table 4 Pearson, s correlation coefficient and P value between Hg flux and impact factors in spring”的人还看了
-

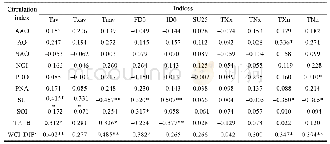
- Table 6 The correlation coefficient values between temperature extremes in CA and atmospheric circulations
-

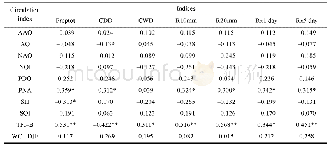
- Table 7 The correlation coefficient values between precipitation extremes in CA and atmospheric circulations


