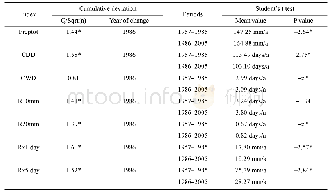
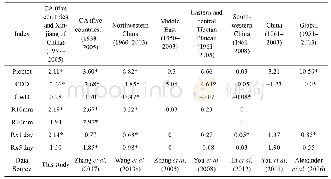
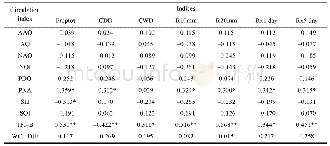
《Table 9 Trends of extreme precipitation indices from this study and other works》
 提示:宽带有限、当前游客访问压缩模式
本系列图表出处文件名:随高清版一同展现
《通过气温和降水极值追踪中亚地区的气候变化(英文)》
Trends significant(significance level<0.05)are marked with*.
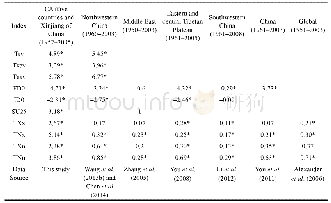
The rise in minimum temperature is the main driving force behind climate warming both globally and regionally.In this study,results showed that faster warming trends occurred at extreme temperature indices rooted in daily minimum temperature(Tnav,FD0,TNx and TNn);indices derived from daily maximum temperature(Txav,ID0,SU25,TXx and TXn)also showed warming trends,but with smaller magnitudes.These results were in accordance with previous studies(Table 8).For example,the increasing rates of TNx and TNn occurred more quickly than TXx and TXn worldwide(Alexander et al.,2006),in China(You et al.,2011),the Middle East(Zhang et al.,2005),northwestern China(Wang et al.,2013b;Chen et al.,2014),southwestern China(Li et al.,2012),and the eastern and central Tibetan Plateau(You et al.,2008),which revealed a notable reduction in the frequency of extreme low temperatures from global to regional perspectives.
| 图表编号 | XD0047164900 严禁用于非法目的 |
|---|---|
| 绘制时间 | 2019.01.01 |
| 作者 | 张曼、陈亚宁、沈彦俊、李宝富 |
| 绘制单位 | College of Resources and Environmental Science, Hebei Normal University、State Key Laboratory of Desert and Oasis Ecology, Xinjiang Institute of Ecology and Geography, CAS、State Key Laboratory of Desert and Oasis Ecology, Xinjiang Institute of Ecology and |
| 更多格式 | 高清、无水印(增值服务) |
查看“Table 9 Trends of extreme precipitation indices from this study and other works”的人还看了
-

- Table 1.Categories of conditions indicated by the Standardized Precipitation Evapotranspiration Index (SPEI) according t
-
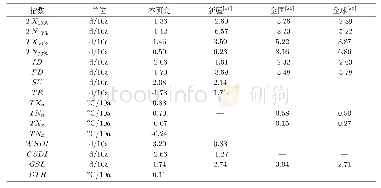
- 表2 1951—2016年哈密极端气温事件变化趋势对比表Tab 2 The Comparison of the Linear Trends of Extreme Temperature Indices between Hami and ot
-
- Table 7 The correlation coefficient values between precipitation extremes in CA and atmospheric circulations


