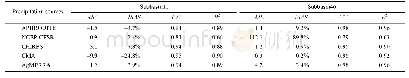
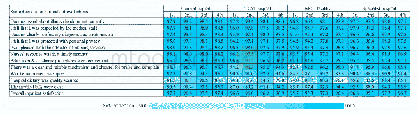
《Table 4 Comparison of four statistical indices of the monthly reanalysis precipitation against the
 提示:宽带有限、当前游客访问压缩模式
本系列图表出处文件名:随高清版一同展现
《Evaluating Suitability of Multiple Precipitation Products for the Lancang River Basin》
Similar to the evaluation of the five daily reanalysis precipitation products,the evaluation is also executed at monthly scale.Four statistical indices:ME,BIAS,CC and R2 were selected to evaluate the accuracy of APHRODITE,NCEP-CFSR,CHIRPS,CMA and AgMERRA.All of the selected four evaluation indices are summarized in Table 4.Table 4 shows that although the CC and R2 improved a lot from daily scale to monthly scale,the increases of CC and R2 for NCEP-CFSR were much less than the other four precipitation products.Also NCEP-CFSR shows the lowest correlation coefficient in both sub-basins compared with the other four precipitation products,a contrast to the NCEP-CFSR daily-scale results.From the ME and BIAS values in Table 4,it can be seen that APHRODITE,CHIRPS and AgMERRA tend to overestimate precipitation while NCEP-CFSR and AgMERRA show the opposite results in subbasin11.However,in subbasin46the evaluation with ME and BIAS exhibits different results,with NCEP-CFSR and CHIRPS showing an overestimation trend while the other three products show opposite results.
| 图表编号 | XD0046956400 严禁用于非法目的 |
|---|---|
| 绘制时间 | 2019.02.01 |
| 作者 | TANG Xiongpeng、ZHANG Jianyun、WANG Guoqing、YANG Qinli、YANG Yanqing、GUAN Ti-esheng、LIU Cuishan、JIN Junliang、LIU Yanli、BAO Zhenxin |
| 绘制单位 | Nanjing Hydraulic Research Institute、State Key Laboratory of Hydrology-Water Resources and Hydraulic Engineering、Hohai University、Nanjing Hydraulic Research Institute、State Key Laboratory of Hydrology-Water Resources and Hydraulic Engineering、Nanjing Hydr |
| 更多格式 | 高清、无水印(增值服务) |