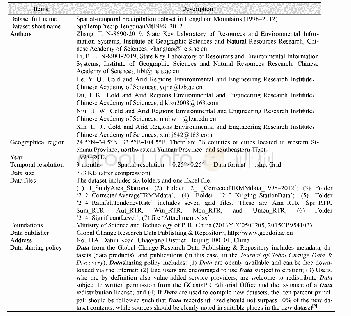
《Table 5 Calibration and verification periods for precipitation derived from different sources over
 提示:宽带有限、当前游客访问压缩模式
本系列图表出处文件名:随高清版一同展现
《Evaluating Suitability of Multiple Precipitation Products for the Lancang River Basin》
Due to the restriction of data usage,this paper does not place the simulation curve of streamflow at the Yunjinghong Station.Table 6 shows the results of daily gauged observations,APHRODITE,CHIRPS,NCEP-CFSR,AgMERRA and CMA-driven SWAT-simulated streamflow from 1 January 1981 to 31 December 2007(with 3 years as a warm-up period),and the monthly simulation results which are calculated by using the daily simulation streamflow.
| 图表编号 | XD0046956300 严禁用于非法目的 |
|---|---|
| 绘制时间 | 2019.02.01 |
| 作者 | TANG Xiongpeng、ZHANG Jianyun、WANG Guoqing、YANG Qinli、YANG Yanqing、GUAN Ti-esheng、LIU Cuishan、JIN Junliang、LIU Yanli、BAO Zhenxin |
| 绘制单位 | Nanjing Hydraulic Research Institute、State Key Laboratory of Hydrology-Water Resources and Hydraulic Engineering、Hohai University、Nanjing Hydraulic Research Institute、State Key Laboratory of Hydrology-Water Resources and Hydraulic Engineering、Nanjing Hydr |
| 更多格式 | 高清、无水印(增值服务) |
查看“Table 5 Calibration and verification periods for precipitation derived from different sources over Yunjinghong, Jiuzhou”的人还看了
-

- Table 5 Ten-day average temperature and average precipitation in each growth stage of spring maize in Pengzhou City in t


![Table 1 The average temperature(oC)and precipitation(mm)of Madoi county[4–5]](http://bookimg.mtoou.info/tubiao/gif/QQSJ201901013_02400.gif)