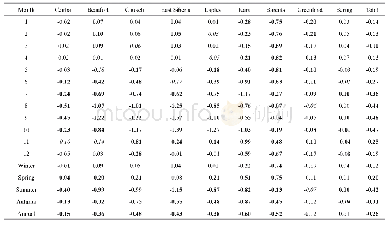
《Table 1 SIC trends (%/a) for the period 1979–2016》
 提示:宽带有限、当前游客访问压缩模式
本系列图表出处文件名:随高清版一同展现
《Satellite-observed trends in the Arctic sea ice concentration for the period 1979–2016》
Bold(italic)numbers indicate rates reaching the 99%(95%)signifi cance level.
Temporal variations in the SIC ablation trends among the Arctic sub-regions are indicated in the variations of the monthly trends(Fig.4),for which the detailed statistics are summarized in Table 1.From January to May,the variations in the monthly sea ice trends for the most parts(except the Barents Sea)are small(Fig.4),ranging from-0.40%/a(May in the Kara Sea,signifi cant at a 99%confi dence level)to0.07%/a(April in the Bering Sea,90%level).The Barents Sea shows a faster SIC decrease than the other regions,ranging between-0.69%(March,99%level)and-0.82%/a(April,99%level).After June,the negative trends of sea ice in the Beaufort Sea,Chukchi Sea,Laptev Sea and Kara Sea become distinct and commonly reach maximum declination rates in September.Beginning in October,the SIC trends in the aforementioned marginal seas shift to a slower rate of decrease.From November to December,the decreasing SIC trends in these regions are further reduced.Among the investigated areas,the Barents Sea stands out with the smallest SIC decrease occurring during the summer rather than the winter in contrast with the other areas(Fig.3).The SIC trends in the Laptev Sea and Greenland Sea are relatively stable,which is suggested by their overall weak seasonal variations(Fig.4).
| 图表编号 | XD0034428300 严禁用于非法目的 |
|---|---|
| 绘制时间 | 2019.01.01 |
| 作者 | WANG Yunhe、BI Haibo、HUANG Haijun、LIU Yanxia、LIU Yilin、LIANG Xi、FU Min、ZHANG Zehua |
| 绘制单位 | CAS Key Laboratory of Marine Geology and Environment, Institute of Oceanology, Chinese Academy of Sciences、University of Chinese Academy of Sciences、CAS Key Laboratory of Marine Geology and Environment, Institute of Oceanology, Chinese Academy of Sciences |
| 更多格式 | 高清、无水印(增值服务) |
查看“Table 1 SIC trends (%/a) for the period 1979–2016”的人还看了
-
- Table 2 2016—2018 nurses’sociodemographic characteristics and trends of the agreement rates of defensive medical examina
-
- Table 2 2016—2018 nurses’sociodemographic characteristics and trends of the agreement rates of defensive medical examina
-
- Table 1 2016—2018 doctors’sociodemographic characteristics and trends of the agreement rates of defensive medical examin


