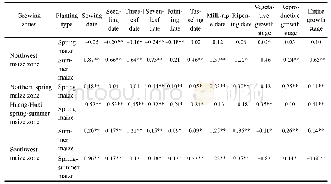
《Table 1 Changing trends of climate factors during the entire growth period of maize in different re
 提示:宽带有限、当前游客访问压缩模式
本系列图表出处文件名:随高清版一同展现
《气候变化背景下1981-2010年中国玉米物候变化时空分异(英文)》
Note:“+”and“-”indicate that the climate factor increased or decreased,**and*indicate significance levels at 0.01 or0.05 respectively.
The spatial distribution of the trends in average air temperature,precipitation,sunshine duration,and GDD changes during maize growing season at each selected site from 1981 to2010 is shown in Figure 2.Throughout the country,average air temperature and GDD increased from 1981 to 2010 by 0.03°C/yr and 4.92°C d/yr,respectively.Precipitation and sunshine duration showed decreasing trends,and the decrease rates were–0.16 mm/yr and–2.07 h/yr,respectively(Table 1).Average air temperature and GDD showed increasing trends at 90%and 83%of the selected sites,respectively,and the increase in air temperature was greater at high than at low latitudes.
| 图表编号 | XD0047166800 严禁用于非法目的 |
|---|---|
| 绘制时间 | 2019.03.01 |
| 作者 | 刘玉洁、秦雅、葛全胜 |
| 绘制单位 | Key Laboratory of Land Surface Pattern and Simulation, Institute of Geographic Sciences and Natural Resources Research, CAS、University of Chinese Academy of Sciences、Key Laboratory of Land Surface Pattern and Simulation, Institute of Geographic Sciences a |
| 更多格式 | 高清、无水印(增值服务) |
查看“Table 1 Changing trends of climate factors during the entire growth period of maize in different regions”的人还看了
-

- Tab.1 Statistics in hydro-climatic variables in the upper reaches of the Luan River Basin during 1966-2015
-

- Table 1 Magnitude of average air temperature trends globally (IPCC, Climate Change 2013) and in China dur-ing different


