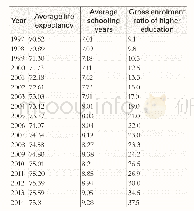
《Table 1 The Variation Trend of Population Quality of China》
 提示:宽带有限、当前游客访问压缩模式
本系列图表出处文件名:随高清版一同展现
《"Population Quality-based Demographic Dividend,Industrial Transformation and Sustainable Development of the Chinese Economy and Society"》
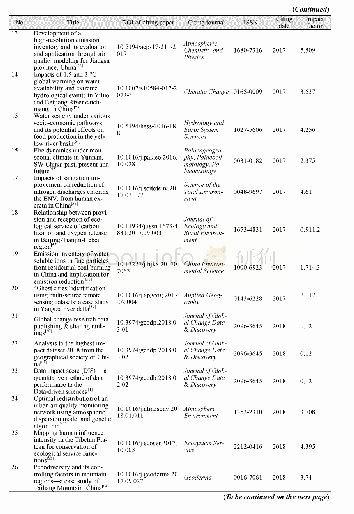
Sources:The figures concerning average life expectancy are from the World Health Organization’s annual World Health Reports.The average schooling years= (population having received primary school education*6+population having received junior high school e
The effects of population changes are not only represented by the changes of population quantity,but also by the changing population quality and structure.In terms of population quality,when a certain input of resources is ensured,the decrease of population necessarily signifies more investment in population quality.This rule also applies to a family,at the micro level,and a country,at the macro level.Since the reform and opening-up,Chinese population quality has seen steady enhancements owing to the continuous increase of investments in public health and education.Table 1 reflects the changes in the Chinese population quality by using three internationally recognized measures:average life expectancy,average schooling years and the gross enrolment ratio of higher education.
| 图表编号 | XD0014483600 严禁用于非法目的 |
|---|---|
| 绘制时间 | 2018.05.30 |
| 作者 | Yang Chenggang、Xu Qingtong |
| 绘制单位 | Population Research Institute,Southwestern University of Finance and Economics |
| 更多格式 | 高清、无水印(增值服务) |