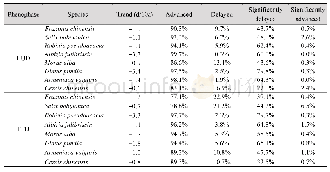
《Table 3 Statistics of the trend in variation of autumn phenological time of five typical deciduous
 提示:宽带有限、当前游客访问压缩模式
本系列图表出处文件名:随高清版一同展现
《中国5种暖温带木本植物叶全变色期数据集(1963–2015)》
The results of autumn phenophase simulation showed that the LCD of all species was spatially different depending on latitude and altitude,with the latest LCD in the eastern and southern regions in China(Figure 2).The time distribution of each species indicated that the average LCD of Armeniaca vulgaris(Figure 2e)was relatively early,whereas that of Robinia pseudoacacia(Figure 2c)was relatively late.The LCD time range was also different.The range of LCD was larger for Fraxinus chinensis,Salix babylonica,and Ulmus pumila than that for other species.A linear regression between LCD and year was used to determine the trend of autumn phenology.The results of the trend analysis(Table 3)showed that the LCD was delayed in 83.7%–99.5%of the pixels for most species,except for Ulmus pumila.Among the other species,the delaying trends were most distinct for Robinia pseudoacacia and Armeniaca vulgaris,with 83.7%and 81.6%of the pixels showing significant delay,respectively.The LCD of Ulmus pumila was advanced in 70.8%pixels,but only in3.2%of the pixels the advancing trends were significant(P<0.05).In general,except for Ulmus pumila(-0.4 d/10a),the LCD of all species showed a distinct delaying trend over the last 50 years,with an average trend of 0.5–0.8 days per decade.
| 图表编号 | XD00168617900 严禁用于非法目的 |
|---|---|
| 绘制时间 | 2019.12.24 |
| 作者 | 朱梦瑶、戴君虎、陶泽兴、王焕炯、刘浩龙、董晓宇、胡植 |
| 绘制单位 | 中国科学院地理科学与资源研究所中国科学院陆地表层格局与模拟重点实验室、中国科学院大学、中国科学院地理科学与资源研究所中国科学院陆地表层格局与模拟重点实验室、中国科学院大学、中国科学院地理科学与资源研究所中国科学院陆地表层格局与模拟重点实验室、中国科学院地理科学与资源研究所中国科学院陆地表层格局与模拟重点实验室、中国科学院地理科学与资源研究所中国科学院陆地表层格局与模拟重点实验室、长安大学地球科学与资源学院、中国科学院地理科学与资源研究所中国科学院陆地表层格局与模拟重点实验室、中国科学院大学 |
| 更多格式 | 高清、无水印(增值服务) |
查看“Table 3 Statistics of the trend in variation of autumn phenological time of five typical deciduous broad-leaved woody pl”的人还看了
-

- 表4 凤阳城区居住小区季相常用植物应用Table 4 The table of Seasonal variation plants in the residential area of Fengyang county
-

- Table 3 Statistics on the shifting trend in the spring phenophase of eight typical deciduous broad-leaved woody plants i
-

- Table 2 The trend of incidence and mortality of prostate cancer in Zhejiang cancer registration areas, 2010~2014


