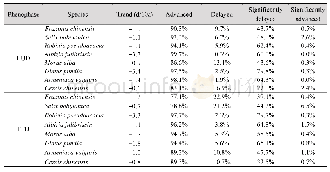
《Table 3.The time trend of the vertical mass flux in the tropics at 100hPa and 70 hPa (units:108 kg/
 提示:宽带有限、当前游客访问压缩模式
本系列图表出处文件名:随高清版一同展现
《"Evaluating the Brewer–Dobson circulation and its responses to ENSO, QBO, and the solar cycle in different reanalyses"》
To assess the BDC comprehensively from different datasets,the composite responses to ENSO,QBO,and solar cycle are also compared among the reanalyses and CESM1-WACCM after the trends are removed for the BDC and other variables.The El Ni?o event is selected when the winter mean Ni?o3.4(5°S–5°N,170°–120°W)index is above 1.0 standard deviation,and the Ni?a event is selected when the winter mean Ni?o3.4 index is below–1.0 standard deviation.We also change the threshold from±1.0 to±0.5 standard deviations,but the composite BDC response patterns are similar between the two criteria,although the response amplitude using the±0.5 standard deviation is smaller for every reanalysis and CESM1-WACCM.The QBO index is defined as the equatorial(5°S–5°N)zonal mean zonal wind at 50 hPa(White et al.,2015;Rao J and Ren RC,2017,2018).Considering the asymmetry of the QBO westerlies and easterlies,all years are ranked according to the equatorial zonal mean zonal wind amplitudes.Nearly one third of years from 1970–2010 are selected as the QBO westerly years,one third as the QBO easterly years,and the other one third as the QBO neutral years.Namely,the nine strongest westerly years are selected as the westerly QBO events;and the nine strongest easterly years are selected as the easterly QBO events.The maximum solar years are selected when the winter solar flux 10.7 cm is above 1.0 standard deviation,and the minimum solar years are selected when the solar flux is below–1.0 standard deviation.The composite BDC difference between solar maxima and solar minima are also insensitive to the criteria if we change the threshold between 0.5 and 1.5 standard deviations.The extreme events for ENSO,QBO,and solar cycle are shown in Table 4.
| 图表编号 | XD0030290900 严禁用于非法目的 |
|---|---|
| 绘制时间 | 2019.03.01 |
| 作者 | Jian Rao、YueYue Yu、Dong Guo、ChunHua Shi、Dan Chen、DingZhu Hu |
| 绘制单位 | Key Laboratory of Meteorological Disaster, Ministry of Education (KLME)、Joint International Research Laboratory of Climate and Environment Change(ILCEC)、Collaborative Innovation Center on Forecast and Evaluation of Meteorological Disasters (CIC-FEMD), Nan |
| 更多格式 | 高清、无水印(增值服务) |
查看“Table 3.The time trend of the vertical mass flux in the tropics at 100hPa and 70 hPa (units:108 kg/s/yr) .The single ast”的人还看了
-

- 表3 基于Hurst指数、线性回归趋势系数的合肥未来温度趋势判断Tab.3 The forecast of trend of temperature in Hefei area based on Hurst exponent and the
-

- Table 3 Statistics on the shifting trend in the spring phenophase of eight typical deciduous broad-leaved woody plants i
-

- Table 3 Statistics of the trend in variation of autumn phenological time of five typical deciduous broad-leaved woody pl


