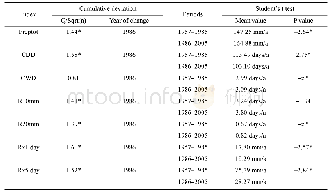
《Table 5 Abrupt change of extreme precipitation indices based on the test results of cumulative devi
 提示:宽带有限、当前游客访问压缩模式
本系列图表出处文件名:随高清版一同展现
《通过气温和降水极值追踪中亚地区的气候变化(英文)》
Trends significant(significance level<0.05)are marked with*.
Taking into consideration the unique climate characteristics of CA,we selected for our study10 extreme temperature indices(Tav,Txav,Tnav,FD0,ID0,SU25,TXx,TXn,TNx,TNn)and 7 extreme precipitation indices(Prcptot,CDD,CWD,R10mm,R20mm,Rx1 day,Rx5day)(Table 1) from 27 ECIs introduced by the CCl/CLIVAR/JCOMM Expert Team on Climate Change Detection and Indices(ETCCDI)(http://etccdi.pacificclimate.org/list_27_indices.shtml) .
| 图表编号 | XD0047165100 严禁用于非法目的 |
|---|---|
| 绘制时间 | 2019.01.01 |
| 作者 | 张曼、陈亚宁、沈彦俊、李宝富 |
| 绘制单位 | College of Resources and Environmental Science, Hebei Normal University、State Key Laboratory of Desert and Oasis Ecology, Xinjiang Institute of Ecology and Geography, CAS、State Key Laboratory of Desert and Oasis Ecology, Xinjiang Institute of Ecology and |
| 更多格式 | 高清、无水印(增值服务) |
查看“Table 5 Abrupt change of extreme precipitation indices based on the test results of cumulative deviation and student’s t”的人还看了
-

- 表4 1961-2014年黄河源区年平均及季节平均蒸发量突变分析结果Table 4 Abrupt changes of the annual and seasonal mean pan evaporations in the source


