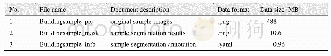
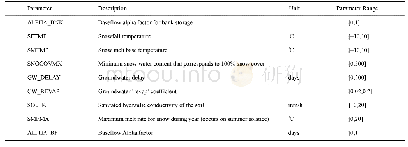
《Table 1 Description of the precipitation products used in this study》
 提示:宽带有限、当前游客访问压缩模式
本系列图表出处文件名:随高清版一同展现
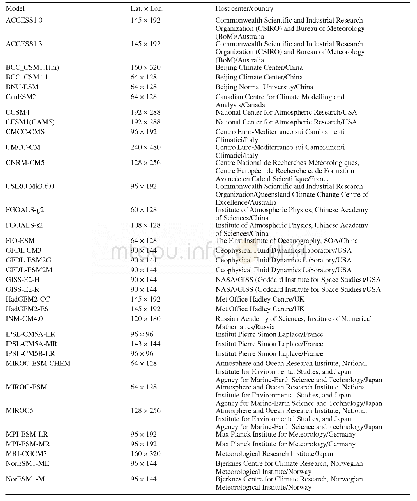
《Comparison of precipitation products to observations in Tibet during the rainy season》
To accurately characterize the reliability of precipitation products,the spatial(Figure 8)and temporal variation(Table 3)tendencies were investigated during the rainy season in Tibet.The mean precipitation trend(Figure 8a)is distributed heterogeneously over Tibet.Precipitation exhibits an increasing tendency in most regions of Tibet from 1980 to 2013.The maximum increasing trend is identified at Mangkang(32.87 mm/10a)while the minimum is identified at Shiquanhe(0.42 mm/10a).The area with most significant increased precipitation is located in a river valley in the middle of Tibet.Regions with drying trends are located in most regions of Lyingchi and in the southern regions of Ngari and Qamdo.The maximum drying trend is located in Bomi with a value of29 mm/10a and the minimum drying trend is located in Pulan(2.04 mm/10a)County of Ngari region.Therefore,the regions with increasing precipitation are located in most regions of Tibet with different magnitudes and those with an opposite variation trend are primarily situated in southeastern and southern Tibet along the Himalayas.
| 图表编号 | XD0023782100 严禁用于非法目的 |
|---|---|
| 绘制时间 | 2018.10.01 |
| 作者 | Zhuo Ga、Za Dui、Duodian Luozhu、Jun Du |
| 绘制单位 | Lhasa Branch of Chengdu Institute of Plateau Meteorology,China Meteorological Administration、Tibet Climate Center,Tibet Meteorological Bureau、Lhasa Meteorological Bureau、Lhasa Meteorological Bureau、Tibet Climate Center,Tibet Meteorological Bureau |
| 更多格式 | 高清、无水印(增值服务) |
