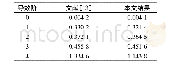
《Table 2 Correlation coefficient, root mean square error (RMSE) , and mean of air temperature and wi
 提示:宽带有限、当前游客访问压缩模式
本系列图表出处文件名:随高清版一同展现
《Numerical simulation of the climate effect of high-altitude lakes on the Tibetan Plateau》
Note:The units of temperature and wind speed are°C and m/s,respectively.
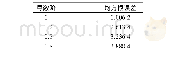
Observed and simulated half-monthly average air temperature and wind speed are presented in Figure 3.Both Case 1 and Case 2 can adequately simulate the annual variation of air temperature.However,from November to the next April,the simulated temperature was relatively low at the Ngoring Lake and the Madoi Station;and the wind speed at the Madoi Station was clearly higher.The mean value,correlation coefficient,and root mean square error(RMSE)of the simulation and observation are listed in Table 2.The precipitation observation occurred only in summer and autumn at the Ngoring Lake,where the effective period for the precipitation observation was 158 days.During this period,the accumulative precipitations for the observation,Case 1,and Case 2 were 390.2,621.7,and 604.0 mm for the Ngoring Lake,respectively.The simulation values were clearly higher,and Case 2 was closer to the observation.At Madoi,the effective period of precipitation observation was 460days.The accumulative precipitations for the observation,Case 1,and Case 2 were 735.9,799.9,and 901.4 mm,respectively.Case 1 was closer to the observation(Figure 4).
| 图表编号 | XD0023782000 严禁用于非法目的 |
|---|---|
| 绘制时间 | 2018.10.01 |
| 作者 | YinHuan Ao、ShiHua Lyu、ZhaoGuo Li、LiJuan Wen、Lin Zhao |
| 绘制单位 | Key Laboratory of Land Surface Process and Climate Change in Cold and Arid Regions, Northwest Institute of Eco-Environment and Resources, Chinese Academy of Sciences、Plateau Atmosphere and Environment Key Laboratory of Sichuan Province, School of Atmosphe |
| 更多格式 | 高清、无水印(增值服务) |


