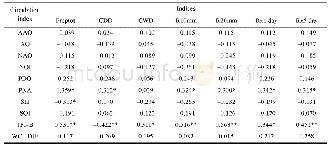
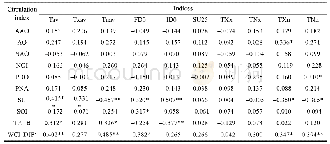
《Table 3.Correlation coefficients between the BKS SIE and the domain-averaged SAT over Novaya Zemlya
 提示:宽带有限、当前游客访问压缩模式
本系列图表出处文件名:随高清版一同展现
《Evaluation of the HadISST1 and NSIDC 1850 onward sea ice datasets with a focus on the Barents-Kara seas》
The winter mean SAT over Novaya Zemlya and Franz Josef Land is calculated from the CRU’s observational global land SAT dataset or the CMIP5 models.Similarly,the BKS SIE can easily be derived.A substantially negative correlation between the BKS SIE and the domainaveraged SAT is seen in the two ice datasets(Table 2)and nearly all of the models(Table 3).The correlation coefficients of the domain-averaged SAT with the BKS SIE in the two observational datasets are-0.74 and-0.78during the satellite era(1979–2013).Additionally,the correlation coefficients in more than two-thirds of the CMIP5 models(16 of 21 models)is less than-0.6.For 19models(all models except FGOALS-g2 and IPSL-CM5A-LR),the correlation coefficients are smaller than-0.32,meaning that the models are above the 90%confidence level.When the analysis period for the models is extended backward to 1960,the significant negative correlation in most of the models remains.
| 图表编号 | XD00882200 严禁用于非法目的 |
|---|---|
| 绘制时间 | 2018.09.16 |
| 作者 | Rui-Bo WANG、Shuanglin LI、Zhe HAN |
| 绘制单位 | College of Atmospheric Sciences, Chengdu University of Information Technology、Climate Change Research Center and Nansen-Zhu International Research Centre, Institute of Atmospheric Physics, Chinese Academy of Sciences、Climate Change Research Center and Nan |
| 更多格式 | 高清、无水印(增值服务) |
查看“Table 3.Correlation coefficients between the BKS SIE and the domain-averaged SAT over Novaya Zemlya and Franz Josef Land”的人还看了
-

- Table 3 Correlation coefficients of biological index and the absolute abundance of dominant species and physic-chemical
-

- Table 7 The correlation coefficient values between precipitation extremes in CA and atmospheric circulations


