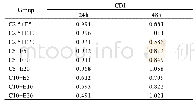
《Table 4.Correlation coefficients of BKS SIE in the Hadley and NSIDC datasets with the reconstructed
 提示:宽带有限、当前游客访问压缩模式
本系列图表出处文件名:随高清版一同展现
《Evaluation of the HadISST1 and NSIDC 1850 onward sea ice datasets with a focus on the Barents-Kara seas》
Figure 4 compares the BKS SIE in the two datasets with the reconstructed BKS SIE.As seen above,it is unsurprising that the evolution of the SIE prior to 1979(i.e.,1958–78)in the two sea-ice datasets is different.The BKS SIE in the NSIDC dataset is more strongly correlated with the proxy(-0.64)and the reconstructed SIE(0.64)than the Hadley dataset is(-0.26 and 0.26;Tables 2 and 4).This finding suggests that the quality of the sea-ice data from NSIDC is better than that of the data from Hadley.The lower correlation(0.64)of BKS SIE in the Hadley dataset than that in the NSIDC dataset(0.76)with the reconstructed SIE during the whole period from 1958 to 2013 is in agreement with this assessment.Thus,the interannual BKS sea-ice data in the NSIDC data are relatively more reliable.
| 图表编号 | XD00882100 严禁用于非法目的 |
|---|---|
| 绘制时间 | 2018.09.16 |
| 作者 | Rui-Bo WANG、Shuanglin LI、Zhe HAN |
| 绘制单位 | College of Atmospheric Sciences, Chengdu University of Information Technology、Climate Change Research Center and Nansen-Zhu International Research Centre, Institute of Atmospheric Physics, Chinese Academy of Sciences、Climate Change Research Center and Nan |
| 更多格式 | 高清、无水印(增值服务) |
查看“Table 4.Correlation coefficients of BKS SIE in the Hadley and NSIDC datasets with the reconstructed SIE for three period”的人还看了
-

- Table 1 Metadata summary of the“Dataset of fruit types and seed dispersal modes of plants in five com-munities in Shilin
-

- Table 1.Chemical characteristics of rhizosphere and bulk soils associated with L.ruthenicum in the three growth stages
-

- Table 2.Diffusion coefficients at 1300°C of elements in the present alloy and those reported for other Co-based alloy sy


