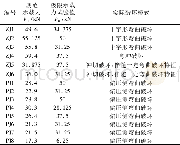
《Table 3 The RMSE, SAE and R2 values between the verified FVC and the predicted FVC by the regressio
 提示:宽带有限、当前游客访问压缩模式
本系列图表出处文件名:随高清版一同展现
《Comparative Analysis of Fractional Vegetation Cover Estimation Based on Multi-sensor Data in a Semi-arid Sandy Area》
Notes:R,NIR,NIRa,RD1,and RD3 represent the red,near-infrared,near-infrared(a),red edge 1 and red edge 3 bands,respectively;B represents the FVC;and A represents the corresponding variable value.
For the S2 MIS sensor,to ensure the best band combination for FVC inversion,the red edge 1(band 5),red edge 3(band 7)and NIRa(band 8a)bands were also used to combine the NDVI and RVI to perform a regression analysis with the verified FVC.For both the NDVI and RVI regression analyses,10 field samples were used to build the regression models,and an additional 10field samples were used to validate the model results.As presented in Table 3 and Fig.6,the R2 of the NDVI 1regression model based on the S2 data(0.927)was higher than that of the model based on the L8 data.In addition,according to the NDVI 1 regression model,compared with that of the L8 data,the RMSE of S2 data decreased by 3.40%,and the SAE decreased by 11.43%.These results suggest that S2 provides results closer to the verified FVC using the NDVI 1 regression model.For the RVI 1 regression model,according to Table 3and Fig.6,the extraction of FVC based on S2 data exhibits good agreement with the verified FVC.Accordingly,the RMSE of the S2 data is 0.09,which is lower than that of the L8 data,and the SAE of the L8 data is24.96%higher than that of the S2 data.These findings indicate that the S2 data are better than the L8 data for estimating FVC using the RVI 1 regression model.
| 图表编号 | XD0046959600 严禁用于非法目的 |
|---|---|
| 绘制时间 | 2019.02.01 |
| 作者 | LIU Qiuyu、ZHANG Tinglong、LI Yizhe、LI Ying、BU Chongfeng、ZHANG Qingfeng |
| 绘制单位 | College of Natural Resources and Environment, Northwest A&F University、College of Natural Resources and Environment, Northwest A&F University、College of Natural Resources and Environment, Northwest A&F University、College of Natural Resources and Environme |
| 更多格式 | 高清、无水印(增值服务) |
查看“Table 3 The RMSE, SAE and R2 values between the verified FVC and the predicted FVC by the regression models”的人还看了
-

- 表5 极限承载力试验值与规范值比较Table 5 Comparison between the test value of ultimate bearing capacity and the estimated value accordin
-

- 表4 马铃薯智能排种机试验值与设计值对比Table 4 Comparison between the test value and design value on the potato intelligent seed metering m
-

- Table 6 The correlation coefficient values between temperature extremes in CA and atmospheric circulations
-

- Table 7 The correlation coefficient values between precipitation extremes in CA and atmospheric circulations


