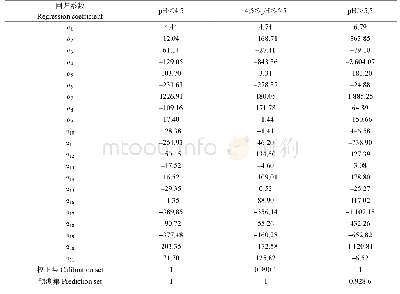
《Table 4 Summary of the R2, explained deviance and P values in all sub-models using the generalized
 提示:宽带有限、当前游客访问压缩模式
本系列图表出处文件名:随高清版一同展现
《"Hierarchical responses of soil organic and inorganic carbon dynamics to soil acidification in a dryland agroecosystem,China"》
Note:a represents that the soil depth interval of 110–170 cm was selected to describe the best relationship between changes in soil p H and SIC;b represents that the soil depth interval of 10–70 cm was selected to describe the best relationship between c
Given the different distribution patterns of changes in soil p H and soil carbon content,we investigated whether there are significant relationships between changes in soil p H and soil carbon content at different soil depths by comparing their explained deviance and significance value in the sub-models of GAM.The full model comparison is listed in Table 4.The results show that SOC content and SIC content showed different responses to the changes in soil p H.For the optimal relationship between changes in soil p H and SOC content,the changes in soil p H at the0–80 cm soil depth explained 51.3%of the changes in SOC content(P=0.006;Fig.3).In contrast,the changes in soil p H at the 100–180 cm soil depth only explained 12.3%of the changes in SOC content(P=0.310).The optimal relationship between changes in soil p H and SIC content was found at the 100–180 cm soil depth(Fig.3).The changes in soil p H at this depth explained 16.1%of the changes in SIC content(P=0.015).In contrast,the changes in soil p H at the 0–80 cm soil depth only explained 5.5%of the changes in SIC content(P=0.488).These results imply that in calcareous soils,soil acidification will mainly regulate the SOC dynamics in the root layer and the SIC dynamics in the deep soil layer.Furthermore,two piecewise trends for the relationship between soil acidification and SOC dynamics were found.Specifically,when the soil p H decreased by more than 0.2 units,the SOC content would increase significantly;and when the soil p H decreased by less than 0.2 units,the SOC content would decrease profoundly.For the SIC dynamics,this relationship suggests a nearly linear decline in SIC content with soil acidification.
| 图表编号 | XD0020362300 严禁用于非法目的 |
|---|---|
| 绘制时间 | 2018.10.01 |
| 作者 | JIN Shaofei、TIAN Xiaohong、WANG Hesong |
| 绘制单位 | Department of Geography, Ocean College, Minjiang University、Institute of Oceanography, Minjiang University、Key Laboratory of Wetland Ecology and Environment, Northeast Institute of Geography and Agroecology, Chinese Academy of Sciences、College of Natural |
| 更多格式 | 高清、无水印(增值服务) |
查看“Table 4 Summary of the R2, explained deviance and P values in all sub-models using the generalized additive model”的人还看了
-

- 表4 采用多元线性回归模型对茶园土壤p H值定量预测结果Table 4 The predict results of soil p H value in tea garden using multivariate linear regres
-

- Table 1 Metadata summary of“Variation dataset of land use and its ecosystem service value in Yarkant River basin(1978–20
-

- Table 1 Metadata summary of the“Dataset of fruit types and seed dispersal modes of plants in five com-munities in Shilin


