《Table 3 Soil p H change, soil total carbon (STC) stock, SOC stock and SIC stock after a long-term (
 提示:宽带有限、当前游客访问压缩模式
本系列图表出处文件名:随高清版一同展现
《"Hierarchical responses of soil organic and inorganic carbon dynamics to soil acidification in a dryland agroecosystem,China"》
Note:N0,N120 and N240 represent the N fertilizer application levels of 0,120 and 240 kg N/(hm2·a),respectively.P values were obtained from the one-way ANOVA.Mean±SD;n=3.
At each soil depth,there were no significant difference in soil p H and soil carbon contents among different N fertilizer application levels(Fig.1)and N fertilization exhibited no significant effect on both soil p H and soil carbon contents(Table 2),after a long-term(12 years)N fertilization in the experimental field.However,there was a marginally significant effect of N fertilization on soil p H in relation to soil depths after the long-term N fertilization(P=0.058;Table 3).The soil p H value decreased in all three N fertilizer treatments after the long-term N fertilization in the experimental field(Table 3).Although the N fertilization did change the soil carbon stock at the0–200 cm soil depth,the recommended N fertilizer application rate(i.e.,N120)had the highest SOC stock.Meanwhile,the projected N fertilizer application rate(i.e.,N240)had the lowest SIC stock.
| 图表编号 | XD0020362400 严禁用于非法目的 |
|---|---|
| 绘制时间 | 2018.10.01 |
| 作者 | JIN Shaofei、TIAN Xiaohong、WANG Hesong |
| 绘制单位 | Department of Geography, Ocean College, Minjiang University、Institute of Oceanography, Minjiang University、Key Laboratory of Wetland Ecology and Environment, Northeast Institute of Geography and Agroecology, Chinese Academy of Sciences、College of Natural |
| 更多格式 | 高清、无水印(增值服务) |
查看“Table 3 Soil p H change, soil total carbon (STC) stock, SOC stock and SIC stock after a long-term (12 years) N fertiliza”的人还看了
-

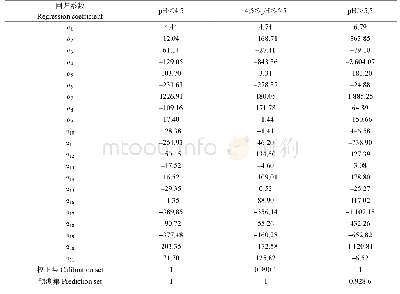
- 表4 采用多元线性回归模型对茶园土壤p H值定量预测结果Table 4 The predict results of soil p H value in tea garden using multivariate linear regres
-

- Table 2 Changes in main chemical properties of alkaline-saline soil before and after soil improvement


