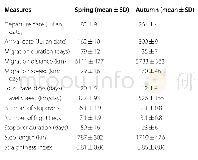
《Table 2 Summary table comparing the mean values of autumn and spring migration parameters generated
 提示:宽带有限、当前游客访问压缩模式
本系列图表出处文件名:随高清版一同展现
《Spring migration duration exceeds that of autumn migration in Far East Asian Greater White-fronted Geese (Anser albifrons)》
Data from the full spring migration routes(Fig.1a)showed that the Greater White–fronted Geese(n=11)wintered mainly in the middle and lower Yangtze River,most of them wintering in Poyang Lake(n=8).Some birds changed wintering sites during the subsequent wintering period from Shengjin Lake to Poyang Lake(n=2)and Dongting Lake to Poyang Lake(n=1).After leaving wintering areas,they travelled~5000 km to their breeding areas either in the Lena Delta(n=7)or the southern tundra zone of Proliv Dmitriya Lapteva(n=4,Figs.1a,2).Most stopover sites were in Northeast China on both migration episodes(Fig.1a,b).Most birds left wintering areas in late March,arrived at breeding/summering areas in early June,started autumn migration in late September,and returned to wintering areas in late October(Table 2 and see Additional file 1:Table S1 for full details of stopover sites).The duration of migration was significantlylonger(t18=9.7,p<0.001;Fig.3a)in spring(mean=79±12 days,range=64–97 days,n=11)than autumn(35±7 days,range=20–43 days,n=9).However,the distances the tagged birds travelled during spring migration and autumn did not differ significantly(t16=2.0,p=0.062;Fig.3b,spring:6111±477 km,range=5457–7295 km,n=11;autumn:5733±363 km,range=5155–6146 km,n=9).The straightness indices of both migration seasons were almost theidentical(t17=–1.9,p=0.072,spring:0.81±0.06,range=0.66–0.89,n=11;autumn:0.86±0.06,range=0.80–0.95,n=9)and close to the shortest distance which is the displacement of the initial and final points during one migration trip between wintering and breeding sites.Travel speed differed significantlybetween the two seasons(t9=–3.9,p=0.003;Fig.3c,spring:mean=327.0±93.2 km/day,range=198.6–512.0 km/day,n=11;autumn:526.1±155.4 km/day,range=296.4–819.3 km/day,n=9).Total travel days also differed significantly(t8=5.0,p=0.001;Fig.3d,spring:mean=20.03±5.45 days,range=12.25–29.25 days,n=11;autumn:mean=11.87±3.91 days,range=6.29–18.71 days,n=9).The major difference in migration duration was the result of significantly longer cumulative stopover duration(t16=6.5,p<0.001;Fig.3e,spring:59±16 days,range=40–84 days,n=11;autumn:23±6 days,range=10–28.79 days,n=9).Geese used significantly more stopovers in spring(mean=6.1±1.9,range=2–9,n=11)than in autumn(mean=2.1±0.8,range=1–3,n=9;t17=5.9,p<0.001;Fig.3f).Full details of the locations and duration of stopovers used by tagged individuals are provided in Additional file 1:Table S1.
| 图表编号 | XD00109451500 严禁用于非法目的 |
|---|---|
| 绘制时间 | 2019.09.01 |
| 作者 | Xueqin Deng、Qingshan Zhao、Lei Fang、Zhenggang Xu、Xin Wang、Haoren He、Lei Cao、Anthony David Fox |
| 绘制单位 | State Key Laboratory of Urban and Regional Ecology, Research Center for Eco-Environmental Sciences, Chinese Academy of Sciences、University of Chinese Academy of Sciences、State Key Laboratory of Urban and Regional Ecology, Research Center for Eco-Environme |
| 更多格式 | 高清、无水印(增值服务) |
查看“Table 2 Summary table comparing the mean values of autumn and spring migration parameters generated from tagged Greater”的人还看了
-
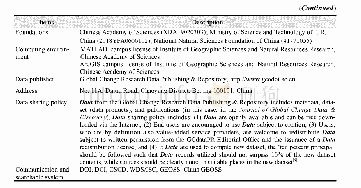
- Table 1 Metadata summary of“Autumn phenological grid dataset of typical deciduous broad-leaved woody plants in the warm
-
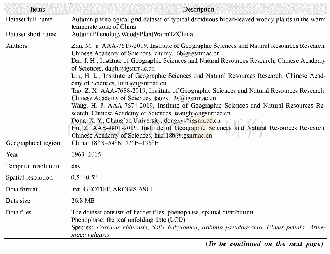
- Table 1 Metadata summary of“Autumn phenological grid dataset of typical deciduous broad-leaved woody plants in the warm
-
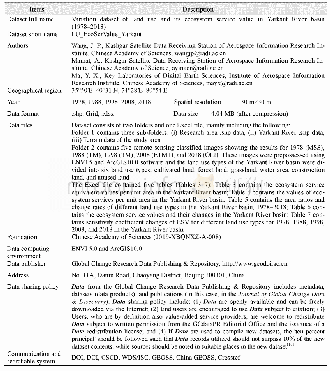
- Table 1 Metadata summary of“Variation dataset of land use and its ecosystem service value in Yarkant River basin(1978–20
-
- Table 1 Mean value±SD of environmental variables at the 8 studied sites in the Jidu River and the Fengdian River in Apri


![Table1 Comparing the advantages and disadvantages of photocatalytic system and existing water treatment methods[4, 7, 8]](http://bookimg.mtoou.info/tubiao/gif/SCMA201903002_31900.gif)