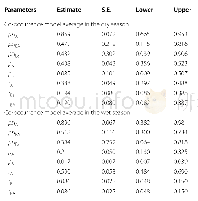
《Table 2 Tibetan Snowcock detection probability (p) models》
 提示:宽带有限、当前游客访问压缩模式
本系列图表出处文件名:随高清版一同展现
《Habitat use and diel activity pattern of the Tibetan Snowcock(Tetraogallus tibetanus):a case study using camera traps for surveying high-elevation bird species》
(a) We list all models,and present AICc weight,number of parameters(No.par.),twice the negative log likelihood(2LL).(b)Summed model weight of each detection covariates.The key for the covariate codes used is given in Table 1
Neither of the two detection covariates(DATE and LT)reached summed model weights of>0.5(Table 2),indicating that they had no significant effect on detection probability of the Tibetan Snowcock,and detection probability was assumed to be constant.Out of 92 camera traps,69 recorded Tibetan Snowcock at least once,resulting in a na?ve site occupancy of 0.663.The model with the lowest AICc estimated the occupancy at 0.830(Table 3),slightly higher than the na?ve site occupancy,suggesting that the habitat use of the Tibetan Snowcock was wider than indicated by the camera trap record.Among competing models,elevation,slope,EVI,road density,and settlement density reached summed model weights of>0.5,and these covariates were considered as weighted predictors for the habitat use of the Tibetan Snowcock.There was a positive correlation between habitat use and elevation,road density,and settlement density,while habitat use was negatively associated with slope and EVI(Fig.4).
| 图表编号 | XD0047412400 严禁用于非法目的 |
|---|---|
| 绘制时间 | 2019.03.01 |
| 作者 | Gai Luo、Chuangming Yang、Huaming Zhou、Michael Seitz、Yongjie Wu、Jianghong Ran |
| 绘制单位 | Key Laboratory of Bio-Resources and Eco-Environment of Ministry of Education,College of Life Science,Sichuan University、Key Laboratory of Bio-Resources and Eco-Environment of Ministry of Education,College of Life Science,Sichuan University、The Administrat |
| 更多格式 | 高清、无水印(增值服务) |
查看“Table 2 Tibetan Snowcock detection probability (p) models”的人还看了
-

- Table 3 Co-occurrence model average estimates of occupancy(psi)and detection parameters(p and r)of two sympatric Gallifo
-

- Table 1 Frequencies of PVR development in normal group, PVR model group (P) , and etanercept-treated group (T) at differ
-

- Table 1 Variables used to estimate the site occupancy rate and detection probability of Tibetan Snowcock in the occupanc


