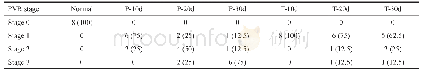
《Table 1 Frequencies of PVR development in normal group, PVR model group (P) , and etanercept-treate
 提示:宽带有限、当前游客访问压缩模式
本系列图表出处文件名:随高清版一同展现
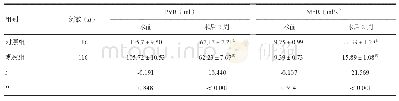
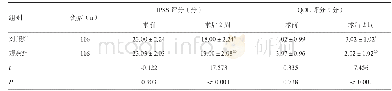
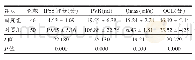
《Effect of etanercept on post-traumatic proliferative vitreoretinopathy》
n (%)
Proliferative responses were evaluated according to fundus images and B-scan.An eye which presented with stage 2 or greater was considered retinal detachment,whose incidences were 0 in normal group,2(25%)on 10d after intravitreal injection in PVR model group(P-10d),6(75%)on 20d(P-20d),7(87.5%)on 30d(P-30d);0 on 10d after intravitreal injection in etanercept-treated group(T-10d),2(25%)on20d(T-20d),and 3(37.5%)on 30d(T-30d)(Table 1) .The difference among the three groups at different time points was statistical significance(P=0.014).Significant differences were found in the retinal detachment rate between PVR model group and etanercept-treated group at different time points(P=0.027).
| 图表编号 | XD0051750800 严禁用于非法目的 |
|---|---|
| 绘制时间 | 2019.05.18 |
| 作者 | Xiao-Feng Chen、Mei Du、Xiao-Hong Wang、Hua Yan |
| 绘制单位 | Department of Ophthalmology,Tianjin Medical University General Hospital、Ineye Hospital of Chengdu University of Traditional Chinese Medicine、Department of Ophthalmology,Tianjin Medical University General Hospital、Department of Ophthalmology,Tianjin Medica |
| 更多格式 | 高清、无水印(增值服务) |


