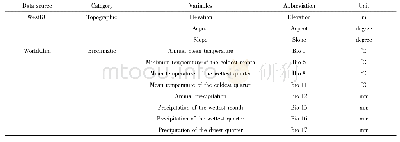
《Table 2 Bioclimatic and topographic variables used for modelling the suitable distribution of Subps
 提示:宽带有限、当前游客访问压缩模式
本系列图表出处文件名:随高清版一同展现
《气候变化对黄土高原及邻近地区稀有种枯蝉分布的潜在影响(英文)》
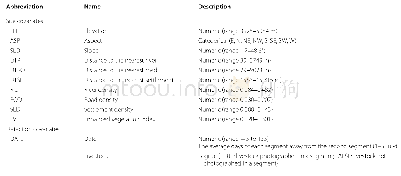
The WorldClim database provides a total of 19bioclimaticvariables,whichdiscriminateat approximately 1 km2resolution(Hijmans et al.,2005;http:∥www.worldclim.org).The WorldClim data are derived from measurements of altitude,temperature and rainfall from weather stations worldwide during 1950-2000.In this research,the Pearson correlation coefficient r≤±0.85 is used as a cut-off threshold to determine the exclusion of highly correlated variables(Yi et al.,2016).According to the correlation analysis of19 bioclimatic variables,eight bioclimatic variables(Bio 1,Bio 6,Bio 8,Bio 11,Bio 12,Bio 13,Bio16,and Bio 17)were reserved(see Table 2 for detailed information).All variables were processed using ArcMap software(version 10.2,ESRI,USA).
| 图表编号 | XD0036515000 严禁用于非法目的 |
|---|---|
| 绘制时间 | 2019.01.20 |
| 作者 | 王振鹏、彭守璋、贺志强、魏琮 |
| 绘制单位 | 西北农林科技大学植物保护学院、西北农林科技大学水土保持研究所、塔里木大学植物科学学院、西北农林科技大学植物保护学院 |
| 更多格式 | 高清、无水印(增值服务) |