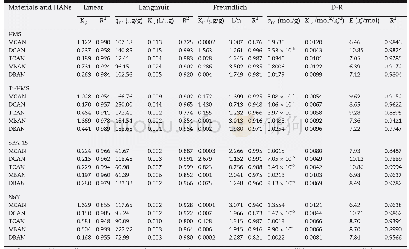
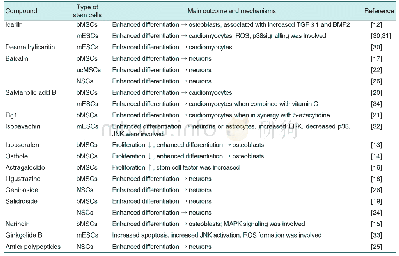
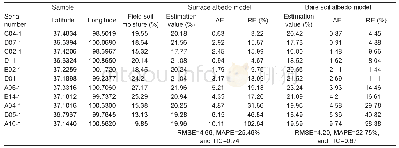
《Table 1 Comparison of ACD-estimation models derived from area-based (1, 2, 3) and tree-centric (4,
 提示:宽带有限、当前游客访问压缩模式
本系列图表出处文件名:随高清版一同展现
《Airborne laser scanning of natural forests in New Zealand reveals the influences of wind on forest carbon》
Terms in the models include basal area(BA)and wood density(ρ)recorded in plots,Top-of-the-Canopy Height(TCH)and residual variation in canopy cover(Cover10)estimated from ALS data,as well as Crown Diameter(CD)and Height(H)of individual overst
With such an large dataset,computational efficiency is essential.Thus we opted to map carbon using Model 1in Table 1,even though delineation methods produce slightly more accurate predictions.There were 4.5 million measurements of top-of-the-canopy height within the natural old-growth and secondary forests of Wellington Region,each estimated from the ALS canopy height model averaged over 25 m×25 m.
| 图表编号 | XD003825300 严禁用于非法目的 |
|---|---|
| 绘制时间 | 2018.06.01 |
| 作者 | David A.Coomes、Daniel afka、James Shepherd、Michele Dalponte、Robert Holdaway |
| 绘制单位 | Department of Plant Sciences, University of Cambridge、Department of Plant Sciences, University of Cambridge、Landcare Research, Riddet Rd, Massey University、Landcare Research, Riddet Rd, Massey University、Department of Sustainable Agro-Ecosystems and Biore |
| 更多格式 | 高清、无水印(增值服务) |
查看“Table 1 Comparison of ACD-estimation models derived from area-based (1, 2, 3) and tree-centric (4, 5) Li DAR statistics”的人还看了
-

- Table 1 Comparison of fitting effects of random forest regression model before and after parameter tuning
-
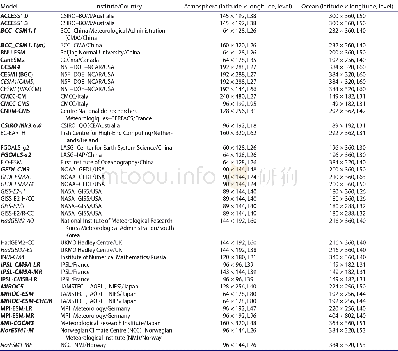
- Table 1.details of the cmip5 models.All the models are used to derive the 1.5 and 2°c threshold-crossing time in Figure
-
- 表2 不同种源苦豆子种子及植株表型性状的比较Seed and plant traits comparison of Sophora alopecuroides derived from different sources


