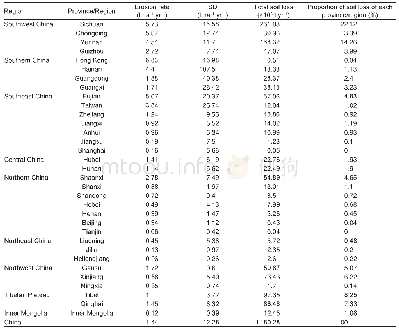
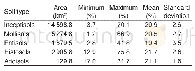
《Table 3 Estimates of annual soil loss potential across China》
 提示:宽带有限、当前游客访问压缩模式
本系列图表出处文件名:随高清版一同展现
《Modelling and mapping soil erosion potential in China》
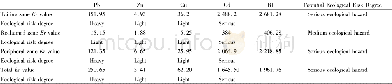
To assess the skill of our modelling,we compared the predicted potential soil erosion rates with erosion rates measured on runoff plots collected from the literature(Table 5).All plots were selected according to the following criteria:(i)under natural rainfall conditions and(ii)obtained from direct measurements with site and plot-data descriptions for interpretation were selected.A total of 237plot data from 22 studies were used in the validation.For each plot,the erosion rate was recorded.The comparison was made by taking erosion rates for both measured and predicted values for the plot locations.
| 图表编号 | XD0047429300 严禁用于非法目的 |
|---|---|
| 绘制时间 | 2019.02.20 |
| 作者 | TENG Hong-fen、HU Jie、ZHOU Yue、ZHOU Lian-qing、SHI Zhou |
| 绘制单位 | College of Environmental and Resource Sciences, Zhejiang University、State Key Laboratory of Soil and Sustainable Agriculture, Chinese Academy of Sciences、College of Environmental and Resource Sciences, Zhejiang University、College of Environmental and Reso |
| 更多格式 | 高清、无水印(增值服务) |

