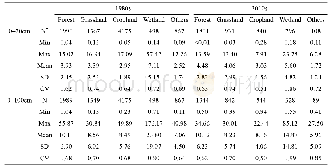
《Table 2 The properties of soil samples and SOC density (kg C m–2) across different ecosystems of Ch
 提示:宽带有限、当前游客访问压缩模式
本系列图表出处文件名:随高清版一同展现
《1980s-2010s中国陆地生态系统土壤碳储量的变化(英文)》
N,sample number;Min,Max and Mean,the minimum,maximum,and mean value of SOC density(kg C m–2);SD,standard deviation;CV,the coefficient of variation.
Based on forest inventories,grassland resources surveys,field measurements,and remote-sensing data,some scientists have assessed terrestrial ecosystem C storage and its changing trends at regional and global scales(Pacala et al.,2001;Janssens et al.,2003;Piao et al.,2009;Pan et al.,2011).In China,most studies focused on vegetation C storage(Fang et al.,2007;Pan et al.,2011)and only a few examined changing trends in SOC storage(Wang et al.,2003;Xie et al.,2007),although some studies estimated SOC storage at regional scales(Wu et al.,2003;Yang et al.,2007;Xu et al.,2015;Yang et al.,2017)(Table 1) .Furthermore,the estimates of SOC storage both at global and regional scale are still uncertain,with the total SOC storage in world’s soils varying from 1395 to 2200 Pg C(Bohn,1982;Eswaran et al.,1993;Batjes,1996;Jobbágy and Jackson,2000),and the SOC storage in China ranging from 50 to 185.7 Pg C(Fang et al.,1996;Pan,1999;Yang et al.,2007)(Table 1) .These wide ranges are mainly attributed to insufficient sampling(Piao et al.,2009;Schrumpf et al.,2011;Wiesmeier et al.,2012;Ni,2013).Compared to vegetation inventories and remote-sensing data,which have been regularly obtained,periodic soil survey is scarce,resulting in the unavailability of contemporary soil C measurements(Hayes et al.,2012;Yang et al.,2014b).Thus,it is urgent to obtain additional robust estimates of SOC by using reliable data and optimized methods at regional or global scales.
| 图表编号 | XD0047165600 严禁用于非法目的 |
|---|---|
| 绘制时间 | 2019.01.01 |
| 作者 | 徐丽、于贵瑞、何念鹏 |
| 绘制单位 | Key Laboratory of Ecosystem Network Observation and Modeling, Institute of Geographic Sciences and Natural Resources Research, CAS、Key Laboratory of Ecosystem Network Observation and Modeling, Institute of Geographic Sciences and Natural Resources Researc |
| 更多格式 | 高清、无水印(增值服务) |
查看“Table 2 The properties of soil samples and SOC density (kg C m–2) across different ecosystems of China in the1980s and 2”的人还看了
-

- Table 1 Comparison on the chemical properties of soil samples cultivated with garden plants for over 3 years and less th
-

- Table 3 Corrosion potential (φcorr) and corrosion current density (Jcorr) of samples A, B, C and D measured in 3 wt.%Na
-

- Table 5 Corrosion potential (φcorr) and corrosion current density (Jcorr) of samples A, B, C and D measured in 0.5 wt.%H


