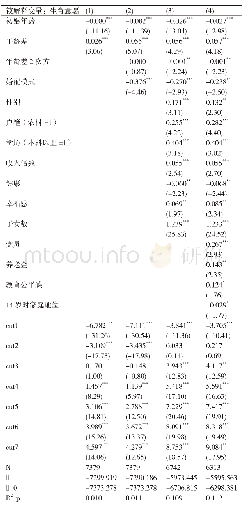
《Table 3 Ordered Logit Regression Estimates for General Impression of China》
Source:Survey of the Image of China.Notes:Cell entries are unstandardized regression coefficients and standard errors.#p<.10;*p<.05;**p<.01;***p<.001.
I begin my analysis by looking at correlations between the two independent variables and the dependent variable—the Taiwanese public’s general feeling toward China.3 The values of chi-square significance of cross-tabulations presented in Tables 1 and 2 indicate that both the objective and subjective measurements have a strong and statistically significant association with Taiwanese citizens’general views of China.As displayed in Table 1,52.5 percent of the individuals who had never been to China had a negative(“very bad”or“bad”)perception of China,compared to 42.5 percent of those who had visited between one and three times,and 44.4percent of those with the most exposure to China.Only 47.5 percent of the respondents who had never been to China professed to having a favorable(“very good”or“good”)impression of China,compared to 57.6 percent of those who had visited one to three times and 55.6 percent of the most frequent visitors.From this preliminary distribution,a decisive trend among the sample of greater exposure leading to a more positive impression is identified.Simply put,Taiwanese people who have visited the mainland more frequently are more likely to view China in a positive light than those who are less frequent visitors or have never been at all.
| 图表编号 | XD00213331600 严禁用于非法目的 |
|---|---|
| 绘制时间 | 2017.05.01 |
| 作者 | 吳重禮 |
| 绘制单位 | 中央研究院政治學研究所 |
| 更多格式 | 高清、无水印(增值服务) |
 提示:宽带有限、当前游客访问压缩模式


