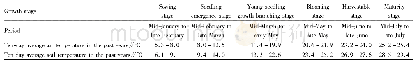
《Table 1.Number of operational days in each month for the Kunming meteor radar》
 提示:宽带有限、当前游客访问压缩模式
本系列图表出处文件名:随高清版一同展现
《Quasi-90-day oscillation observed in the MLT region at low latitudes from the Kunming meteor radar and SABER》
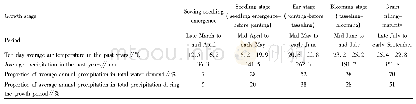
For a better illustration,Table 2 shows the harmonic fit results of the Kunming meteor radar and SABER temperatures.The phases(first maximum after Jan.1,2012)of the AO,SAO,TAO and the quasi-90-day oscillation occur on December 7±7 days,April 20±4days,May 2±3 days and January 15±2 days in the meteor radar temperatures,respectively,and December 3±10 days,April 22±6days,Apr 23±7 and January 15±4 days in the SABER temperatures,respectively(Yi W et al.,2016).
| 图表编号 | XD0030290400 严禁用于非法目的 |
|---|---|
| 绘制时间 | 2019.03.01 |
| 作者 | Wen Yi、XiangHui Xue、JinSong Chen、TingDi Chen、Na Li |
| 绘制单位 | Chinese Academy of Sciences Key Laboratory of Geospace Environment, Department of Geophysics and Planetary Sciences, University of Science and Technology of China、Mengcheng National Geophysical Observatory, School of Earth and Space Sciences, University o |
| 更多格式 | 高清、无水印(增值服务) |