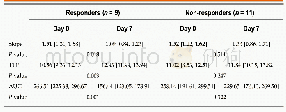
《Table 2 Distribution of changes in time-intensity curve parameters in tumors from day 0 to day 7for
 提示:宽带有限、当前游客访问压缩模式
本系列图表出处文件名:随高清版一同展现
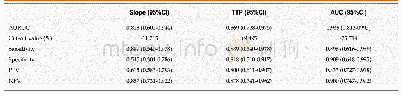
《Change in arterial tumor perfusion is an early biomarker of lenvatinib efficacy in patients with unresectable hepatocellular carcinoma》
The values represent the median[25th-75th percentile].HCC:Hepatocellular carcinoma;TTP:Time to peak;AUC:Area under the curve.
HCC was diagnosed on the basis of an increasing course ofα-fetoprotein,dynamic computed tomography(CT),contrast-enhanced magnetic resonance imaging(MRI),and pathological findings.Between March and November 2018,22 consecutive HCC patients with(1)an Eastern Cooperative Oncology Group(ECOG)performance status score of 2 or less,(2) Child-Pugh liver function class A,and(3)Barcelona Clinic Liver Cancer stage B or C were enrolled in this prospective study to assess the potential of CEUS findings as early imaging biomarkers of lenvatinib efficacy.Two patients were excluded from the analysis owing to data corruption,and so a total of 20 patients were finally included in this study.One target tumor per patient was studied.The baseline characteristics of the patients are summarized in Table 1.
| 图表编号 | XD0064287600 严禁用于非法目的 |
|---|---|
| 绘制时间 | 2019.05.21 |
| 作者 | Hidekatsu Kuorda、Tamami Abe、Yudai Fujiwara、Takuya Okamoto、Miki Yonezawa、Hiroki Sato、Kei Endo、Takayoshi Oikawa、Kei Sawara、Yasuhiro Takikawa |
| 绘制单位 | Division of Hepatology,Department of Internal Medicine, Iwate Medical University、Division of Hepatology,Department of Internal Medicine, Iwate Medical University、Division of Hepatology,Department of Internal Medicine, Iwate Medical University、Division of |
| 更多格式 | 高清、无水印(增值服务) |

