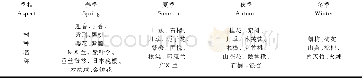
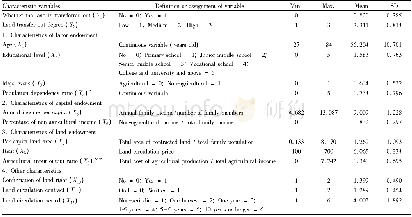
《Table 2 Basic distribution characteristics of residential areas in Nanjing city》
 提示:宽带有限、当前游客访问压缩模式
本系列图表出处文件名:随高清版一同展现
《南京城区住宅小区房价变化地理信息数据集(2009-2017)》
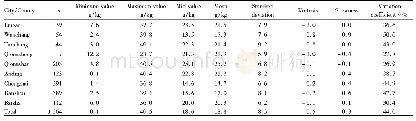
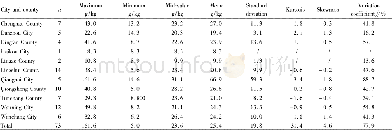
Figure 1 shows the trend of house price fluctuations for all regions of Nanjing during2009-2017.House prices in each region showed an increasing trend,which can be separated into five phases:fast increase during the 1st quarter of 2009 to the 2nd quarter of 2011;relatively stable during the 2nd quarter of 2011 to the 4th quarter of 2012;fast increase during the4th quarter of 2012 to the 2nd quarter of 2014;relatively stable during the 2nd quarter of 2014to the 4th quarter of 2015;and a significant increase during the 4th quarter of 2015 to the 1st quarter of 2017.The data showed an alternating state of“rapid grows”and“relatively stable”.Figure 2 shows the 500 m×500 m grid chart for house prices in all districts of Nanjing.In 2009,house prices decreased from the inner city to Hexi new city,outlying areas of the main city,and the three sub-cities,with an average price of 10,000 Yuan/m2.Jiangbei sub-city had the lowest the average price,less than 5,000 Yuan/m2.By 2017,average house prices had increased to 27,344 Yuan/m2,with a greater difference between the highest and lowest prices.Hexi new city and the inner city school districts became the extremely high house prices area,which reached 50,000-60,000 Yuan/m2.However,houses with an average price lower than 20,000 Yuan/m2 were only found in remote areas such as Liuhe district of Jiangbei Sub-city.
| 图表编号 | XD0027634700 严禁用于非法目的 |
|---|---|
| 绘制时间 | 2018.06.25 |
| 作者 | 尹上岗、马志飞、宋伟轩 |
| 绘制单位 | 南京师范大学地理科学学院、江苏省地理信息资源开发与利用协同创新中心、南京师范大学地理科学学院、江苏省地理信息资源开发与利用协同创新中心、中国科学院南京地理与湖泊研究所流域地理学重点实验室 |
| 更多格式 | 高清、无水印(增值服务) |
