《Table 1–Timing of each operation for wheat and peanut in the 2015–2017 cropping seasons.》
 提示:宽带有限、当前游客访问压缩模式
本系列图表出处文件名:随高清版一同展现
《Timing and splitting of nitrogen fertilizer supply to increase crop yield and efficiency of nitrogen utilization in a wheat–peanut relay intercropping system in China》
To monitor the fate of15N-labeled fertilizer,three microplots(0.4 m×0.5 m×0.5 m;2016–2017)without top and bottom were established within the fertilized plots,with the length perpendicular to the rows at 3–5 cm higher than ground level.15N–labeled urea(46.6%N,20.14 atom%,provided by the Shanghai Chem-Industry Institute)was applied to the microplots in the same doses as applied to the corresponding field trials.The application rates of all other fertilizers(P2O5and K2O)and the application times were the same as those in the field.The number of seeds was calculated according to design in the field and seeds were sown artificially in two rows parallel to the rows in the field.Detailed stages and fractions of15N-labeled fertilizer application are shown in Table 2.
| 图表编号 | XD0029302800 严禁用于非法目的 |
|---|---|
| 绘制时间 | 2019.02.01 |
| 作者 | Zhaoxin Liu、Fang Gao、Yan Liu、Jianqun Yang、Xiaoyu Zhen、Xinxin Li、Ying Li、Jihao Zhao、Jinrong Li、Bichang Qian、Dongqing Yang、Xiangdong Li |
| 绘制单位 | State Key Laboratory of Crop Biology, Shandong Agricultural University、College of Agronomy, Shandong Agricultural University、State Key Laboratory of Crop Biology, Shandong Agricultural University、College of Agronomy, Shandong Agricultural University、State |
| 更多格式 | 高清、无水印(增值服务) |
查看“Table 1–Timing of each operation for wheat and peanut in the 2015–2017 cropping seasons.”的人还看了
-

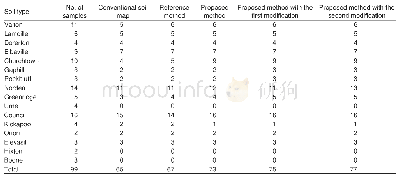
- Table 2 Number of samples for each soil type correctly classified in the conventional soil map and in soil maps updated


