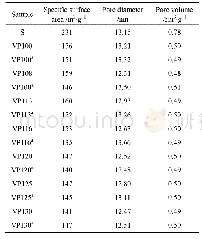
《Table 1 The effect of oxidants on BET surface area, pore volumes and average pore sizes of samples
 提示:宽带有限、当前游客访问压缩模式
本系列图表出处文件名:随高清版一同展现
《Preparation and SO_2 Adsorption Behavior of Coconut Shell——Based Activated Carbon via Microwave-Assisted Oxidant Activation》
Figure 2(a)shows the N2 adsorption-desorption isotherms for the four samples.According to the International Union of Pure and Applied Chemistry(IUPAC)classification,the adsorption isotherm of each sample belongs to type I adsorption isotherm.Each adsorption curve increased sharply for p/p0=0—0.02,and showed a smooth inflection point when p/p0 increased from 0.02 to 0.2,suggesting a wide micropore size distribution.The amount of N2adsorption increased slowly with the increase in relative pressure,and the isotherm exhibited a tailing phenomenon when the relative pressure increased to a certain value.The desorption curve has a significant hysteresis ring and gradually intersects the adsorption curve at p/p0=1.It shows that the samples contained not only micropores,but also mesopores.The N2 adsorption capacity of AC was determined by the SBET and Vtot values.The N2 adsorption capacity of MW-CAC was the largest,which indicated that the microwave-modified CAC had considerably high SBET and Vtot values.However,the CAC samples co-modified with the oxidants demonstrated the reduced SBET and Vtot values.This is consistent with the calculated pore structure parameters listed in Table 1.Figure 2(b)shows the DFT pore size distribution of the samples.It can be seen that the pore size distributions of all the samples were extensive,although they were mainly concentrated in the micropores and small mesopores(2—5 nm).This shows that the modifications by microwave and oxidants had little effect on the pore size distribution of AC.
| 图表编号 | XD0011296100 严禁用于非法目的 |
|---|---|
| 绘制时间 | 2018.03.30 |
| 作者 | Jia Fengrui、Li Zhou、Wang Engang、He Jicheng、Dong Hui、Liu Guangxin、Jian Weiwei |
| 绘制单位 | School of Metallurgy, Northeastern University、College of Petroleum Engineering, Liaoning Shihua University、College of Petroleum Engineering, Liaoning Shihua University、School of Metallurgy, Northeastern University、School of Metallurgy, Northeastern Univer |
| 更多格式 | 高清、无水印(增值服务) |
查看“Table 1 The effect of oxidants on BET surface area, pore volumes and average pore sizes of samples (with microwave power”的人还看了
-

- Table 3.Effects of gradual soil drying on length,surface area and volume of roots in seven rice genotypes.
-

- Table 1–Comparison of the Brunauer–Emmett–Teller (BET) surface area, pore size and pore volume of the different samples.


