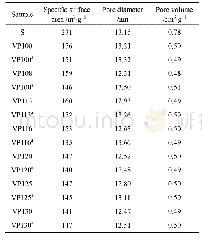
《Table 1 Specific surface areas (SBET) , pore diameters (Dp) and pore volumes (Vp) of different N-Ti
 提示:宽带有限、当前游客访问压缩模式
本系列图表出处文件名:随高清版一同展现
《无模板剂的溶胶-水热法合成具有可见光响应的氮掺杂混晶TiO_2(锐钛矿/金红石/板钛矿)纳米棒束(英文)》
Data for the N-TiO2 nano-rod bundles prepared at different sol-hydrothermal time for the degradation of MO are shown in Fig.8b.It was found that the sol-hydrothermal time significantly affected the degradation rate of MO under visible light irradiation,and the highest MO degradation efficiency was achieved at the sol-hydrothermal time of 18 h.This can be explained by the increase in the surface area,as shown in Fig.9.The sample prepared at120°C for 18 h showed the highest specific surface area(SBET)amongst the various sol-hydrothermal times of 6,12,18 and 24 h.The specific surface areas,as calculated using Brunauer-Emmet-Teller equation,are listed in Table 1.These values are in good consistence with the photocatalytic performance.According to the literature,higher specific surface areas and larger pore volumes of photocata-lysts both contributed to an enhanced photocatalytic activity owing to the presence of a large amount of surface active sites,so it can absorb and transfer reactant molecules easily via the interconnected porous structure,and increase the photocatalytic performance[26,27].
| 图表编号 | XD0029175000 严禁用于非法目的 |
|---|---|
| 绘制时间 | 2019.01.01 |
| 作者 | 刘正江、鲍晓丽、邢磊、杨桔材、张前程 |
| 绘制单位 | 内蒙古工业大学内蒙古自治区工业催化重点实验室、内蒙古工业大学内蒙古自治区工业催化重点实验室、江苏大学绿色化学与化工技术研究院、内蒙古工业大学内蒙古自治区工业催化重点实验室、内蒙古工业大学内蒙古自治区工业催化重点实验室 |
| 更多格式 | 高清、无水印(增值服务) |


