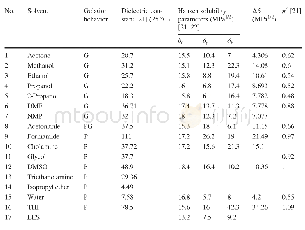
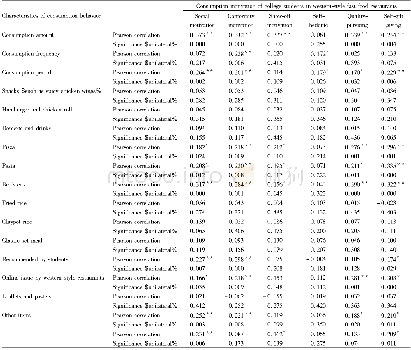
《Table 1 Gelation behaviors of EES in diff erent solvents and solvent parameters analysis》
 提示:宽带有限、当前游客访问压缩模式
本系列图表出处文件名:随高清版一同展现
《Gelation Mechanism of Erythromycin Ethylsuccinate During Crystallization》
G,PG,and P represent gelation,partial gelation,and precipitate,respectively
FTIR characterization was performed on the EES crystals and fi bers.The peaks at 1741 and 1698 cm-1 in Curve a of Fig.8 represent the C=O stretching vibration of ester groups and carbonyl of EES,respectively.For fi bers,the former peak shifted to 1736 cm-1,while the latter disappeared,which could have been masked by the former.It was speculated that ester groups participated in the intermolecular hydrogen bonds as H acceptors,accepting H from the solvent molecules to form the EES solvate fi bers.Furthermore,the red shift of C–O–C vibration peaks in the ester groups and glucosidic bonds also imply the participation of these O atoms in the supramolecular self-assembly of EES solvate fi bers as H acceptors(Table S1).
| 图表编号 | XD0076871200 严禁用于非法目的 |
|---|---|
| 绘制时间 | 2019.04.01 |
| 作者 | Xiandong Su、Zhenguo Gao、Ying Bao、Miao Guan、Sohrab Rohani、Qiuxiang Yin、Hongxun Hao、Chuang Xie、Jingkang Wang |
| 绘制单位 | School of Chemical Engineering and Technology,Tianjin University、Collaborative Innovation Centre of Chemical Science and Engineering (Tianjin)、School of Chemical Engineering and Technology,Tianjin University、Collaborative Innovation Centre of Chemical Sci |
| 更多格式 | 高清、无水印(增值服务) |
查看“Table 1 Gelation behaviors of EES in diff erent solvents and solvent parameters analysis”的人还看了
-
- Table 1 Correlation between consumption motivation and behavior of college students in western-style fast food restauran


