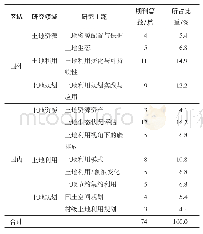
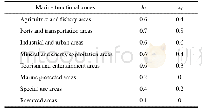
《Table 1 Sea use object classification and resource consumption coefficients》
 提示:宽带有限、当前游客访问压缩模式
本系列图表出处文件名:随高清版一同展现
《"Spatio-temporal Change and Carrying Capacity Evaluation of Human Coastal Utilization in Liaodong Bay,China from 1993 to 2015"》
An object-based image analysis(OBIA)method was used to perform the extraction of different sea use objects(Blaschke,2010;Xu et al.,2013).The main steps were as follows:1) segmentation;2) extraction of descriptive attributes;3) and classification.Segmentation was based upon a series of variables including the scale shape,and compactness of the objects.In the classification procedure,membership categories were assigned to each segment based on membership rules.As well as object shape,features based on spectral,textural,and contextual information were used to create membership rules for the classification.An automated extraction method based on edge detection and tidal correction was used to extract the coastlines(Liu et al.,2004;Zhang et al.,2013).Coastline usage was confirmed by sea use data exported from China’s National Sea Dynamic Surveillance System.
| 图表编号 | XD0046964800 严禁用于非法目的 |
|---|---|
| 绘制时间 | 2019.06.01 |
| 作者 | XU Jingping、LI Fang、SUO Anning、ZHAO Jianhua、SU Xiu |
| 绘制单位 | National Marine Environmental Monitoring Center、National Marine Environmental Monitoring Center、National Marine Environmental Monitoring Center、National Marine Environmental Monitoring Center、National Marine Environmental Monitoring Center |
| 更多格式 | 高清、无水印(增值服务) |
![Table 1 Assessment criteria for the sustainable use of water resources in Yinchuan City[22-31]](http://bookimg.mtoou.info/tubiao/gif/AAGR201810017_21300.gif)


