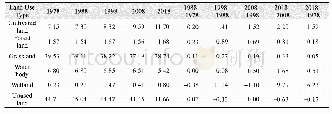
《Table 5 Statistical results of different sea use in Liaodong Bay from 1993 to 2015 (ha)》
 提示:宽带有限、当前游客访问压缩模式
本系列图表出处文件名:随高清版一同展现
《"Spatio-temporal Change and Carrying Capacity Evaluation of Human Coastal Utilization in Liaodong Bay,China from 1993 to 2015"》
We determined changes in the length of the coastline in Liaodong Bay from 1993 to 2015 based on data extracted from the remotely sensed imagery(Table 6)Results showed a progressive increase in the total coastline length and the length of artificial coastline,coupled with a noticeable decrease in the length of natural coastline.Between 1993 and 2008,there was some small variation in the lengths of both artificial and natura coastlines.However,the length of artificial coastline rapidly increased as the proportion of natural coastline decreased from 2008(40.67%)to 2015(16.44%).Based on the spatio-temporal distribution of coastline types(Fig.3),natural coastline was mainly distributed in the western and eastern parts of the bay,including Wafangdian City,Xingcheng City and Suizhong County.In contrast,artificial coastline was mostly located in Linghai City,Wafangdian City and Panshan County.The ratio of natural coastline to the total coastline length and its change over time is shown in Fig.4 for the 12 administrative regions.This shows that Xingcheng City,Suizhong County and Gaizhou City had comparatively high proportions of natural coastline between 1993 and2015.
| 图表编号 | XD0046964900 严禁用于非法目的 |
|---|---|
| 绘制时间 | 2019.06.01 |
| 作者 | XU Jingping、LI Fang、SUO Anning、ZHAO Jianhua、SU Xiu |
| 绘制单位 | National Marine Environmental Monitoring Center、National Marine Environmental Monitoring Center、National Marine Environmental Monitoring Center、National Marine Environmental Monitoring Center、National Marine Environmental Monitoring Center |
| 更多格式 | 高清、无水印(增值服务) |
查看“Table 5 Statistical results of different sea use in Liaodong Bay from 1993 to 2015 (ha)”的人还看了
-

- Table 1 The percentage of language use of the Singapore Chinese in different communicative contexts (%)


