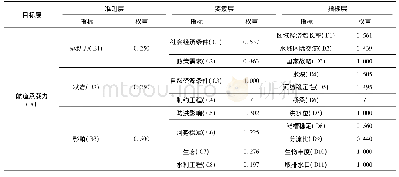
《Table 7 Evaluation of carrying capacity for Liaodong Bay from1993 to 2015》
 提示:宽带有限、当前游客访问压缩模式
本系列图表出处文件名:随高清版一同展现
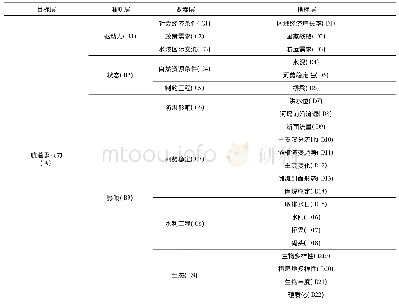
《"Spatio-temporal Change and Carrying Capacity Evaluation of Human Coastal Utilization in Liaodong Bay,China from 1993 to 2015"》
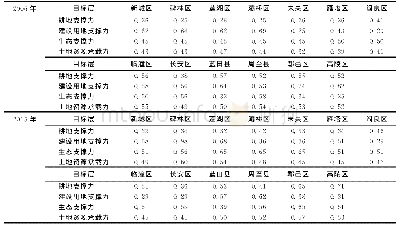
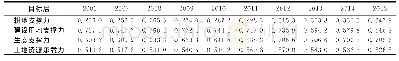
Compared with Cs,Cl was much more variable,as shown in Fig.5b.Of note,the carrying capacity of coastline utilization in Panshan County is not indicated as,according to the marine functional zoning,available coastlines in this county were low,leading to the zero values for wi and Pl.Nevertheless,the coastlines in Panshan County had in fact been exploited to varying degrees during the whole period.Therefore,its classification remained‘overloaded’based on Equation(6)and Table 4.In general,the Cl curve for Liaodong Bay was stable between 1993 and 2008 but showed a notable upward trend from 2008.The intensity of coastline utilization varied in different districts during each period,partly due to changes in the geographical contiguity with the coastline.For example,most areas used for aquaculture and salt industry were distributed along the coast.However,coastlines directly adjacent to these industries had been shortened in cases where the areas were reused for transportation or for reclamation,with many off-shore projects extending out into the sea.
| 图表编号 | XD0046964700 严禁用于非法目的 |
|---|---|
| 绘制时间 | 2019.06.01 |
| 作者 | XU Jingping、LI Fang、SUO Anning、ZHAO Jianhua、SU Xiu |
| 绘制单位 | National Marine Environmental Monitoring Center、National Marine Environmental Monitoring Center、National Marine Environmental Monitoring Center、National Marine Environmental Monitoring Center、National Marine Environmental Monitoring Center |
| 更多格式 | 高清、无水印(增值服务) |

