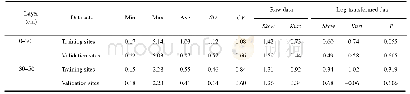
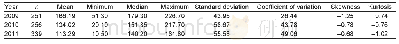
《Table 1 Descriptive statistics of soil electrical conductivity (dS/m) at two soil depths》
 提示:宽带有限、当前游客访问压缩模式
本系列图表出处文件名:随高清版一同展现
《Mapping Soil Electrical Conductivity Using Ordinary Kriging Combined with Back-propagation Network》
Notes:Min,minimum;Max,maximum;Ave,average;SD,standard deviation;CV,coefficient of variation;Skew,skewness;Kurt,kurtosis.
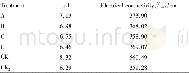
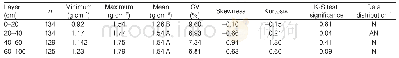
Sensitivity analysis showed that the response of BP was highly dependent on the influencing factors(Table 2).It provided a measure of the relative importance among the inputs of the neural model.In this study,when each input factor was removed at a time while not changing any of another item,each SI showed more than 1.It revealed that all input factors exerted these influences on the soil electrical conductivity at 0–30 and 30–50 cm soil depths.According to the values of SI,the decreasing orders of input importance at 0–30 cm soil depth were as follows:land use types,the distance to irrigation ditches,elevation,distance to drainage ditches and NDVI.The decreasing orders of importance at 30–50cm depth were as follows:land use types,elevation,distance to the irrigation ditches,distance to the drainage ditches and NDVI.
| 图表编号 | XD0046962600 严禁用于非法目的 |
|---|---|
| 绘制时间 | 2019.04.01 |
| 作者 | HUANG Yajie、LI Zhen、YE Huichun、ZHANG Shiwen、ZHUO Zhiqing、XING An、HUANG Yuanfang |
| 绘制单位 | Key Laboratory of Arable Land Conservation (North China), Ministry of Agriculture、Key Laboratory of Agricultural Land Quality Monitoring, Ministry of Land and Resources, College of Resources and Environmental Sciences, China Agricultural University、Key La |
| 更多格式 | 高清、无水印(增值服务) |
