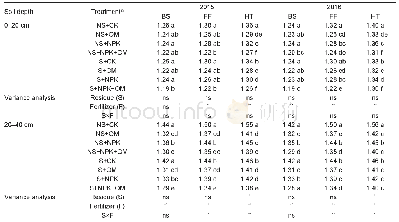
《Table 2 Descriptive statistics of soil bulk density in Chengdu Plain》
 提示:宽带有限、当前游客访问压缩模式
本系列图表出处文件名:随高清版一同展现
《"Spatial variability of soil bulk density and its controlling factors in an agricultural intensive area of Chengdu Plain,Southwest China"》
1) N and AN,normal and approximate normal distribution of soil bulk density,respectively.Mean value with different capital letter in column means significant difference was tested among soil layers at P<0.05.
Spatial structure The best-fitted models for soil bulk density at each layer,taking the R2 and RSS into account,were shown in Table 3 and Fig.2.Spherical model was best fitted for soil bulk density in the 20–40 and 40–60 cm layers.In comparison,Exponential and Gaussian model fitted the best for soil bulk density in the 0–20 and 60–100 cm layers.The range of the semi-variance represented the spatial autocorrelation of soil bulk density.The spatial autocorrelation range increased with soil layer from 4.00 to5.21 km while the nugget effects decreased as the spatial autocorrelation ranges decreasing.The nugget effects for soil bulk density in the 0–20 and 20–40 cm layers were 27.22and 27.02%,respectively,indicating a moderate spatial dependence controlled by both structural and random factors.In contrast,nugget effects in the 40–60 and 60–100 cm layers were 12.06 and 3.46%,respectively,which implied soil bulk density in the layers had strong spatial dependence controlled by structural factors such as parent material,topography and soil type.
| 图表编号 | XD0047430600 严禁用于非法目的 |
|---|---|
| 绘制时间 | 2019.02.20 |
| 作者 | LI Shan、LI Qi-quan、WANG Chang-quan、LI Bing、GAO Xue-song、LI Yi-ding、WU De-yong |
| 绘制单位 | College of Resources, Sichuan Agricultural University、College of Resources, Sichuan Agricultural University、College of Resources, Sichuan Agricultural University、College of Resources, Sichuan Agricultural University、College of Resources, Sichuan Agricultu |
| 更多格式 | 高清、无水印(增值服务) |
查看“Table 2 Descriptive statistics of soil bulk density in Chengdu Plain”的人还看了
-

- Table 4 Soil bulk density (BD, g cm–3) under different residue management and fertilizer treatments in 2015 and 20161)
-

- Table 3.Relative abundances of microbial phyla in rhizosphere and bulk soils at three growth stages.
-

- Table 1.Chemical characteristics of rhizosphere and bulk soils associated with L.ruthenicum in the three growth stages


