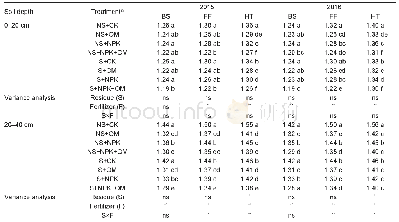
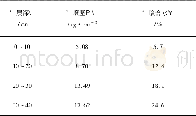
《Table 4 Soil bulk density (BD, g cm–3) under different residue management and fertilizer treatments
 提示:宽带有限、当前游客访问压缩模式
本系列图表出处文件名:随高清版一同展现
《Carbon cycle in response to residue management and fertilizer application in a cotton field in arid Northwest China》
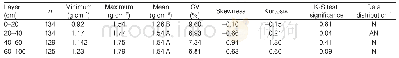
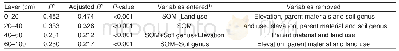
Statistical analysis was completed using the SPSS(22.0)software package for Windows.Two-way ANOVA using general linear model(GLM)procedures was used to test the main and interactive effects of residue management and fertilizer application.The least significant difference(LSD)at the 0.05 level of probability was used to compare means.Correlation analyses were used to test the relationship between each pair of variables.Regression analysis was conducted when the correlations were significant.All figures were prepared with Sigmaplot 12.5.
| 图表编号 | XD0062231000 严禁用于非法目的 |
|---|---|
| 绘制时间 | 2019.05.20 |
| 作者 | ZHANG Peng-peng、XU Shou-zhen、ZHANG Guo-juan、PU Xiao-zhen、WANG Jin、ZHANG Wang-feng |
| 绘制单位 | The Key Laboratory of Oasis Eco-agriculture, Xinjiang Production and Construction Corps, Agricultural College, Shihezi University、The Key Laboratory of Oasis Eco-agriculture, Xinjiang Production and Construction Corps, Agricultural College, Shihezi Univer |
| 更多格式 | 高清、无水印(增值服务) |