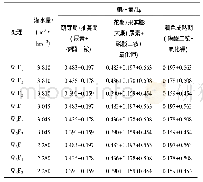
《Table 3 Irrigation date, irrigation amount, and fertilizer amount applied during the cotton growing
 提示:宽带有限、当前游客访问压缩模式
本系列图表出处文件名:随高清版一同展现
《Carbon cycle in response to residue management and fertilizer application in a cotton field in arid Northwest China》
Where,i is the date of the first CO2 measurement,n is the date of the next CO2 measurement,x is the CO2 flux rate(kg ha–1 d–1),and N is the number of days between two consecutive soil CO2 flux measurements.
| 图表编号 | XD0062230900 严禁用于非法目的 |
|---|---|
| 绘制时间 | 2019.05.20 |
| 作者 | ZHANG Peng-peng、XU Shou-zhen、ZHANG Guo-juan、PU Xiao-zhen、WANG Jin、ZHANG Wang-feng |
| 绘制单位 | The Key Laboratory of Oasis Eco-agriculture, Xinjiang Production and Construction Corps, Agricultural College, Shihezi University、The Key Laboratory of Oasis Eco-agriculture, Xinjiang Production and Construction Corps, Agricultural College, Shihezi Univer |
| 更多格式 | 高清、无水印(增值服务) |
查看“Table 3 Irrigation date, irrigation amount, and fertilizer amount applied during the cotton growing season”的人还看了
-

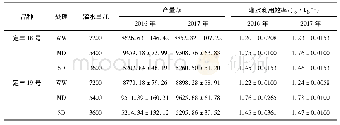
- 表2 各处理全生育期内总灌水量和各生育期单次施肥用量Tab.2 Total irrigation quantity during the whole growth period and fertilizer consumption with


