《Table 4 Average soil temperature at 5 and 25 cm layers under each mulching treatment with days afte
 提示:宽带有限、当前游客访问压缩模式
本系列图表出处文件名:随高清版一同展现
《"Effects of mulches on water use in a winter wheat/summer maize rotation system in Loess Plateau, China"》
Note:The data are the average values of soil temperature over the ridges and in the furrows.Different lowercase letters within a line indicate significant differences among treatments at P<0.05 level at the same soil layer.
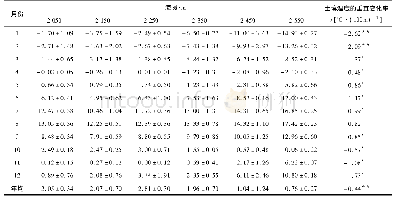
The variation characteristics of average soil temperatures at 5 and 25 cm layers in the wheat season of 2014–2015 were taken as examples(Table 4).Increasing or decreasing in soil temperature caused by different mulching materials was maintained until 210 DAS,although the effects tended to decline with time.Before wintering(0–60 DAS),soil temperatures at both 5 and 25 cm layers were significantly higher in CK than those in M2 and in M3 than those in M4.During 75–120 DAS,M2 had higher temperatures than that in CK,which,to some extent,can protect plants from freezing damage.Relative to M4,the soil temperatures in M3 at 5 and 25 cm layers increased by averages of 0.7°C and 0.4°C,respectively.
| 图表编号 | XD0020360400 严禁用于非法目的 |
|---|---|
| 绘制时间 | 2018.04.01 |
| 作者 | YIN Minhua、LI Yuannong、XU Yuanbo、ZHOU Changming |
| 绘制单位 | Key Laboratory of Agricultural Soil and Water Engineering in Arid and Semiarid Areas, Ministry of Education, Northwest A&F University、College of Water Resources and Architectural Engineering, Northwest A&F University、Key Laboratory of Agricultural Soil an |
| 更多格式 | 高清、无水印(增值服务) |
查看“Table 4 Average soil temperature at 5 and 25 cm layers under each mulching treatment with days after sowing during winte”的人还看了
-

- 表2 长白山西坡苔原带各海拔的土壤月均温和年均温Table 2M onthly and annual mean soil temperatures at different altitudes in the alpine tundra on


![Table 1 The average temperature(oC)and precipitation(mm)of Madoi county[4–5]](http://bookimg.mtoou.info/tubiao/gif/QQSJ201901013_02400.gif)


