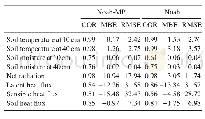
《Table 2.Statistics of daily averaged soil temperature and soil mois-ture at the depth of 10 cm and
 提示:宽带有限、当前游客访问压缩模式
本系列图表出处文件名:随高清版一同展现
《Subdaily to Seasonal Change of Surface Energy and Water Flux of the Haihe River Basin in China: Noah and Noah-MP Assessment》
Notes:all correlation coefficients passed the 95%confidence test.The MBE and RMSE are inC.
The soil temperature was validated at the depth of 10 and40 cm for Miyun station(Fig.2).Generally,the soil temperatures are underestimated in the two LSMs.The discrepancies between Noah-MP outputs and observations are slight when the simulation begins,suggesting that the discrepancy might be linked with sensor calibration errors.The shallow soil layer shows more consistency between simulations and observations than that of the deep soil layer,as revealed by lower MBE values(Table 2).The soil temperature is underestimated by approximately 1.00?C in the upper soil layer,and by about 2.00?C in the deeper soil layer.Compared with Noah-MP,Noah shows more bias,with RMSE of approximately 2.76?C in the shallow soil layer and 3.57?C in the deeper soil layer.The warm season soil temperatures are overestimated,while the cold season soil temperatures are underestimated,especially for the deeper soil layer,in Noah.This result is inconsistent with previous studies(Jin et al.,1999;Chen et al.,2014),possibly because of our physics process selections.Given the semi-humid and semi-arid transitional climate in the HRB(annual average temperature ranges from 9.2?C to 13.5?C),we did not take into consideration snow processes and supercooled liquid water parameterizations.This may have resulted in underestimations of the winter soil temperature at this station.Although Noah treats the canopy and snow physics simply,it shows comparable performance with other more complicated LSMs(Niu et al.,2011;Cai et al.,2014a;Chen et al.,2014).
| 图表编号 | XD0030265400 严禁用于非法目的 |
|---|---|
| 绘制时间 | 2019.01.10 |
| 作者 | Fuqiang YANG、Li DAN、Jing PENG、Xiujing YANG、Yueyue LI、Dongdong GAO |
| 绘制单位 | Key Laboratory of Regional Climate-Environment for Temperate East Asia,Institute of Atmospheric Physics,Chinese Academy of Sciences、University of Chinese Academy of Sciences、Key Laboratory of Regional Climate-Environment for Temperate East Asia,Institute |
| 更多格式 | 高清、无水印(增值服务) |


