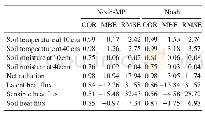
《Table 3 Daily average and coefficient of variation (CV) of soil water content (SWC) at depths of 10
 提示:宽带有限、当前游客访问压缩模式
本系列图表出处文件名:随高清版一同展现
《Sap flow characteristics and physiological adjustments of two dominant tree species in pure and mixed plantations in the semi-arid Loess Plateau of China》
Note:CV is the ratio of standard deviation to mean value×100%.Mean±SD.
The daily SFn for P.tabuliformis and H.rhamnoides in pure plantations generally exhibited a decreasing trend during the observation period;meanwhile,the daily SFn for both these two species in mixed plantation exhibited a\""U\""type,with the higher value occurring in June and September(Fig.2).The variation of daily SFn for P.tabuliformis in the plantation was significantly different(t=4.95,P<0.01,df=226)from that for the same species in mixed plantation.However,there was no significant difference(t=1.95,P=0.053,df=226)in daily variation of SFn for H.rhamnoides in pure and mixed plantations.Generally,the relative response of SFn for these two species significantly increased(P<0.05,df=2)among three rainfall classes in both pure and mixed plantations(Fig.3),when 10–15 mm class was not considered.However,no significant difference was observed either between rainfall classes of 5–10 and>15 mm for P.tabuliformis in pure plantation(P=0.09,df=7),or between rainfall classes of 0–5 and 5–10 mm for H.rhamnoides in pure plantation(P=0.14,df=7).Moreover,the CVs of SFn for P.tabuliformis and H.rhamnoides in pure plantation were 39.1%and 37.59%,and were 43.64%and 36.58%for corresponding species in mixed plantation,respectively(Table 4).
| 图表编号 | XD0020364000 严禁用于非法目的 |
|---|---|
| 绘制时间 | 2018.12.01 |
| 作者 | TANG Yakun、WU Xu、CHEN Yunming |
| 绘制单位 | State Key Laboratory of Soil Erosion and Dry-land Farming on the Loess Plateau, Northwest A&F University、State Key Laboratory of Soil Erosion and Dry-land Farming on the Loess Plateau, Institute of Soil and Water Conservation, Chinese Academy of Sciences |
| 更多格式 | 高清、无水印(增值服务) |
查看“Table 3 Daily average and coefficient of variation (CV) of soil water content (SWC) at depths of 10, 20, 50, 100, and 15”的人还看了
-

- 表2 水文站年均径流季节分配及季节径流变差系数Cv Table 2Seasonal runoff percentages and variation coefficients at the tw o hydrometric stations
-

- Table 5Multiple comparisons of multiplication coefficient and average fresh weight at various swing angle levels


